
I’ve been getting so many content ideas from Reddit. Reddit is so underrated on so many levels — another post for another time (follow me on Reddit).
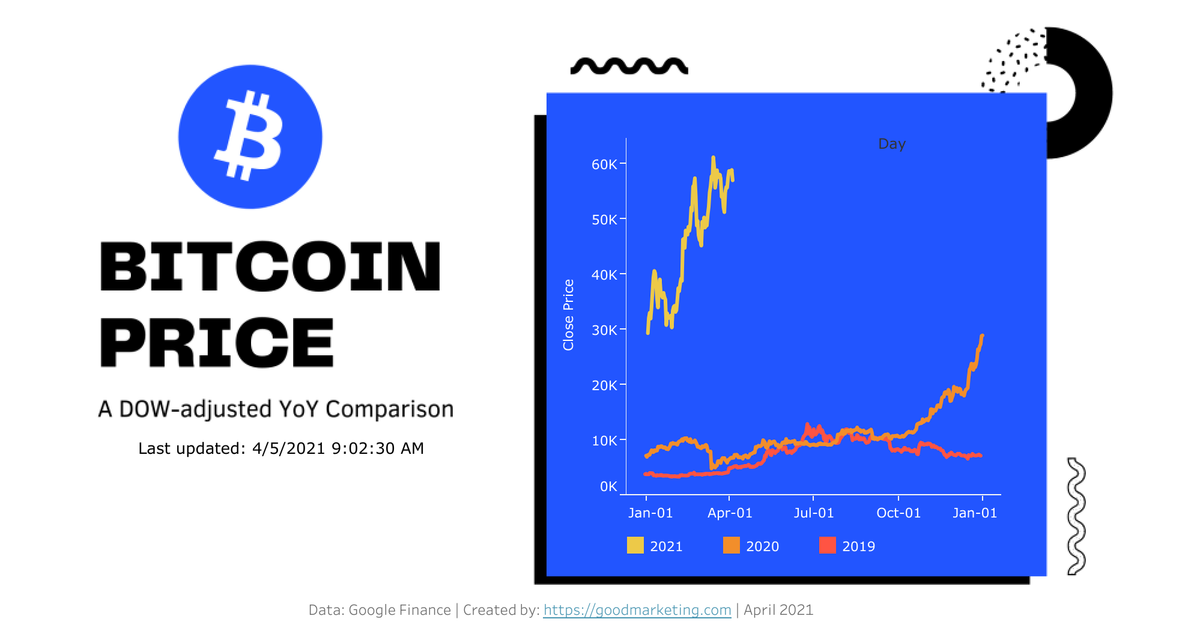
Many people there ask about how to do YoY comparisons in Tableau. Understandably so, it’s one of the most common ways to benchmark KPIs. In many industries like e-commerce, day of week (DOW) also needs to be matched year over year to do a fair comparison. And this is actually really easy to do it in Tableau.
Join the club to see the video tutorial of this dashboard and many more exclusive content.
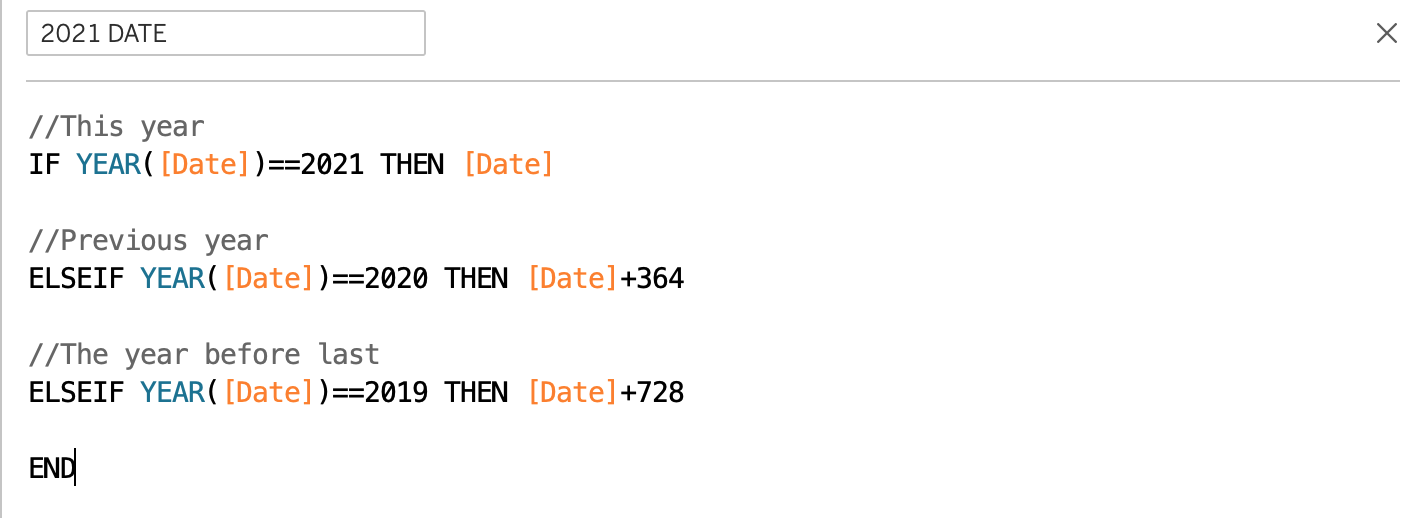
- We use the formula below to adjust the previous year's dates to this years with DOW adjusted and create a new field
2021 DATE.
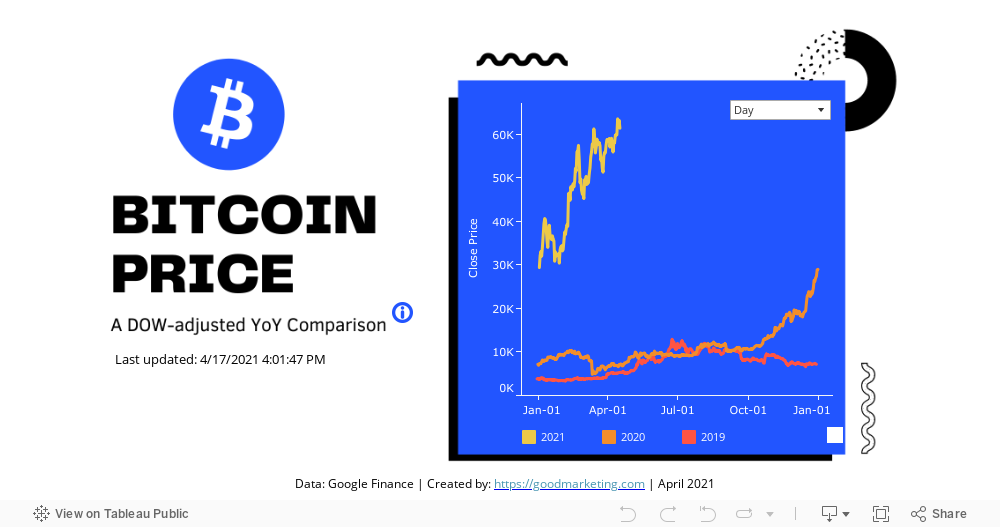
2. Drag the newly created field as the date so every year has the same date field. And use Year(Date) to create the year field, drag to color card to create the lines.
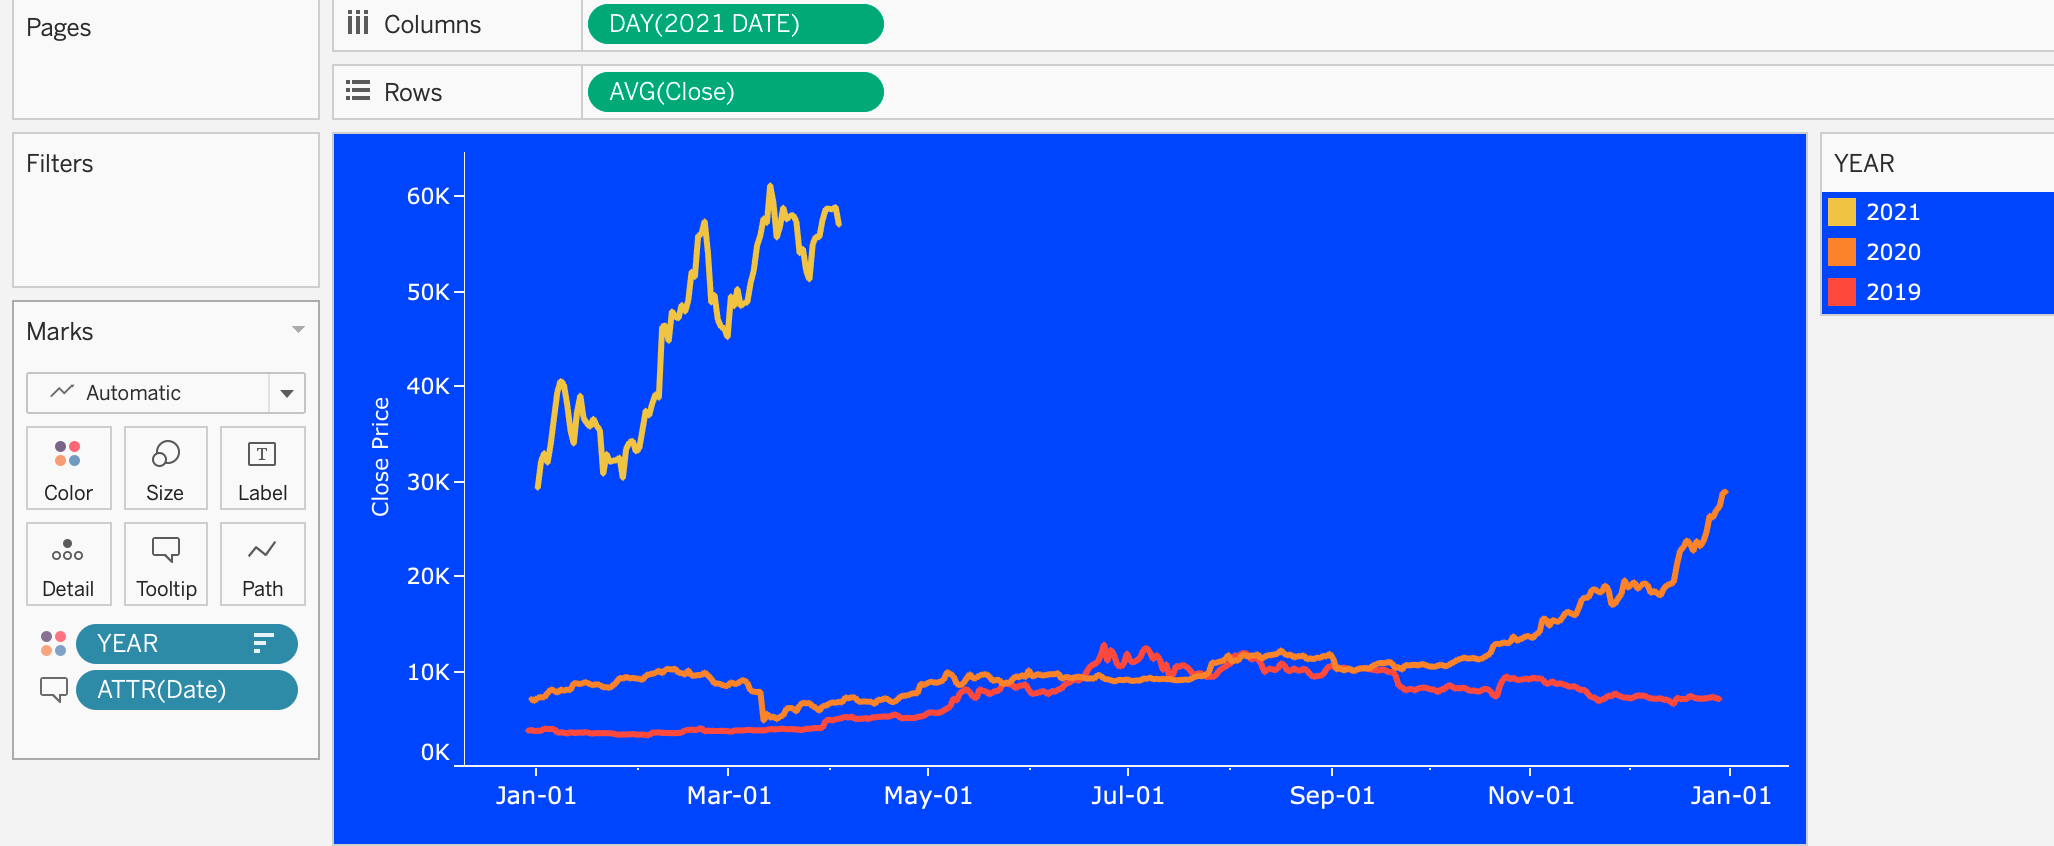
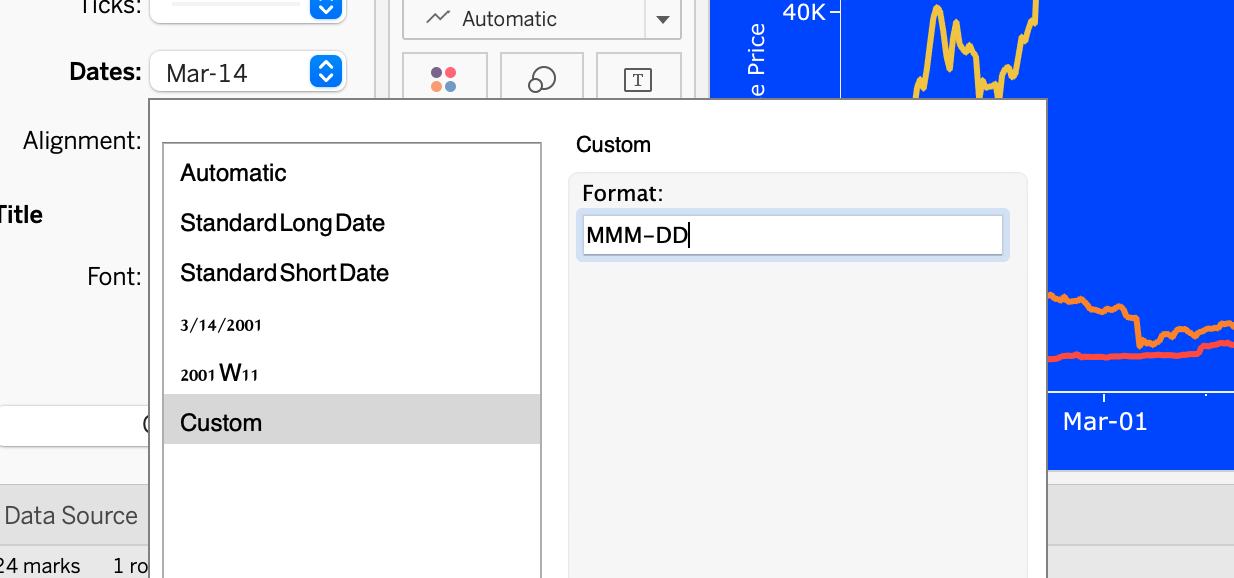
3. Adjust the format of the 2021 Date field so it only shows month and day
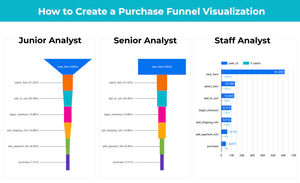
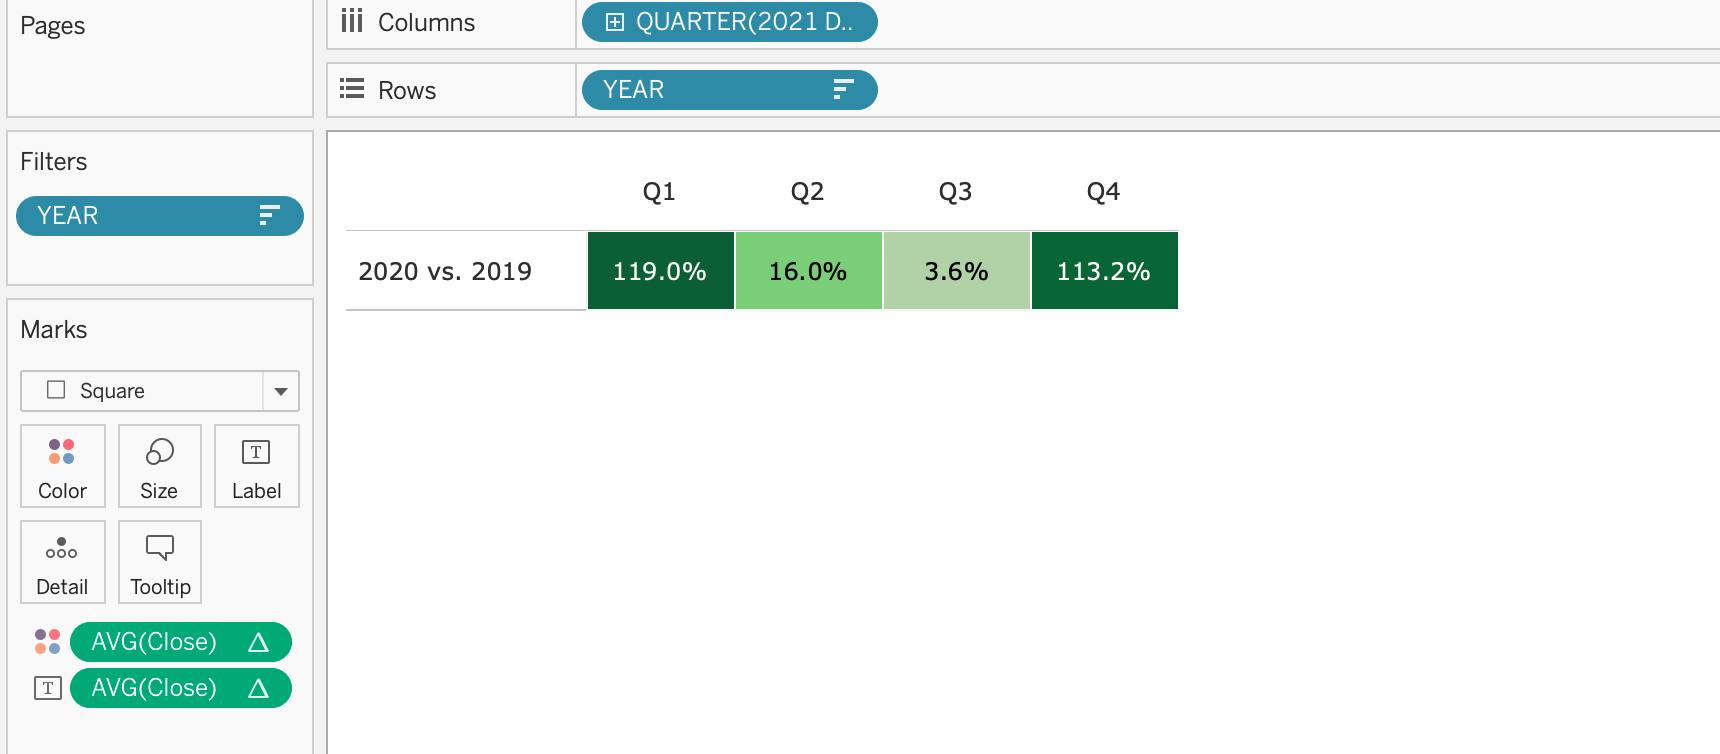
4. If you were to do a YoY % comparison like below, you can just put 2021 Date and YEAR into the column and row respectively, and then do a percent difference quick calculation on AVG(Close) computed using YEAR relative to next/prev.
P.S. Most of my visualization backgrounds are made with Canva. Highly recommend if you want to create these designs in a snap of fingers.