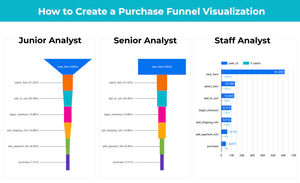

When I was learning D3, although there are a lot of great resources to learn from, I can rarely find detailed code explanations for me to fully understand how everything works, making it difficult to recreate a chart on my own without additional searches. So I want to fill this whitespace with a series of D3 (v4) line-by-line code explanations for each chart I create, sharing with you what I’ve figured out.
I’ve started to venture into D3 animations. It’s mind-blowing to see how a couple of lines of code can create these magical transitions. Thank you, Mike Bostock!
In this post, I will go through a simple text transition. I hope this post can make it easier for you if you are looking for similar solutions.
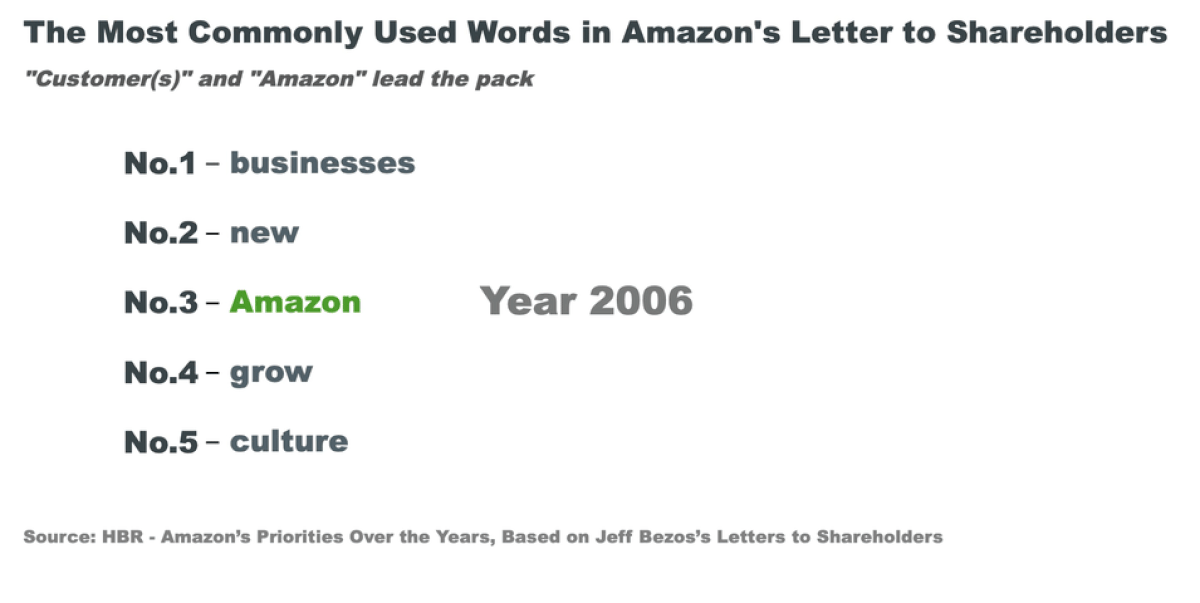
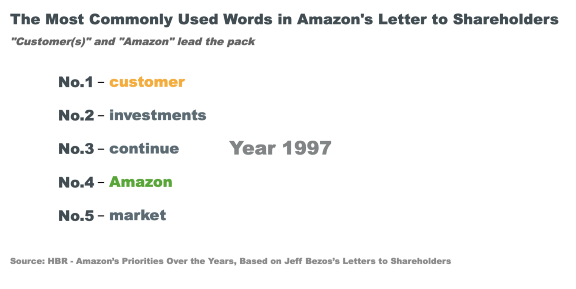
Viz goal: Show the top-5 most commonly used words in Amazon’s letter to shareholders from 1997–2017 while highlighting the two most used words “customer(s)” and “Amazon”.
Data: HBR article
Visualization Strategy
It’s always helpful to do a simple sketch before you start the coding part.
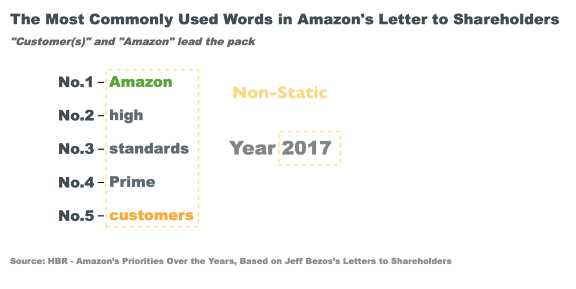
Identify elements that are static and non-static.
- The non-static elements are transitioned by looping the same algorithm through the years.
Out of the loop
- Create static elements like title, subtitle, source, and scale
- Create the first frame of the non-static part to avoid the lag between page load and loop start.
Within the loop
- Start from the second frame of the non-static elements and loop through years
Set up the Canvas
To set up the canvas for D3 graphs, in your HTML file, between <html></html> tags:
- Line 4: Load D3 directly from d3js.org — so you don’t need to install locally and you can use this HTML code in your webpages.
- Line 7–50: Style section to style different elements. Note code like
.sourceis to call and style the ‘source’ class we will define later. - Line 54:
onload= “animated()”means we are telling the system to load theanimted()function immediately to show D3 graphs after the page has been loaded. - Line 58–59: Create a
SVGin the size of 1000px by 600px for us to put graphic elements in later.
The following code is put between <script></script>tags after body in HTML or in a separate .js file.
Create Static and First-frame Elements
- Line 4–8: Input data. The complete data is hidden for a shorter code view.
- Line 10: You don’t necessarily need to use an axis for this type of visualization — I chose it for easier alignment.
d3.scaleBrand()is used for scales of ordinal/categorical variables. By default, the range is divided equally among the elements of the domain. I want the axis to be drawn from top-down from 20px to 200px, theranklabels will be positioned equally in between. - Line 13–14: Set up the
yAxisfunction we will call next.d3.axisLeft()is a function that will create a vertical axis, ticks will be drawn from the axis towards the left, labels will be on the left side of the axis as well. - Line 16: Assign
d3.select(“svg”)tosvgso we don’t need to keep retyping the same command later. - Line 18–22: Draw y-axis. Append “g” to group all elements (ticks/path) so we can move them together
.attr(“transform”,“translate(100,20)”)— 100px along x-axis and 20 along y-axis (origin (0,0) of the SVG Canvas is at the top-left corner). Assign class “axis” to it and call yAxis. Note in the style section we make the path (axis line) color transparent to make it look like a list instead of an axis. - Line 24–44: Put in title, subtitle, and source, which are all static. Assign classes to style them in the style section
- Line 47–54: Create the first frame of “Year 1997”. Filter data
data.filter(d=>d.year=1997)to only include 1997’s data. Then append the dynamicd.yearto the static “Year” using.html(). - Line 56–65: Use a similar approach to create the first frame of the main chart element, the list of words. We want the words to be aligned with the y-axis labels, the ranks, so the y attribute of the word is relative to the y position of labels
.attr(“y”, d => (yScale(d.rank)) + 40). - Line 65: We want to highlight customer(s) and Amazon with different colors. The line means if the word is “customer” or (
||) “customers”, give it the color#f6ae2d, otherwise, the color is#5c6b73. And (&&) if the word is “Amazon”, give it the color#f6ae2d, otherwise, the color is#5c6b73.
Create Transitions
The transitions are created following the logic below:
- we first remove the existing elements (if any) from the DOM using
exit() - then enter the elements that don’t exist on the DOM yet using
enter(). - we will update the data from year to year to make the transition happen.
- Line 1: create a
transitiontext(data)function - Line 4: Start by creating an update selection for years. Select all text under the
“year”class. The second argument of.data(data, d=>d.year)is to specify a key that uniquely identifies the data points (more on this here), in this case, our key is year. - Line 7–8: Remove existing elements under the selection, this will first remove the first frame we created before.
- Line 11–15: Enter the
“year”class elements that don’t exist on the DOM yet, same to how we created the first frame. - Line 18:We then move on to create an update selection for the words, similar to what we did in Line 4.
- Line 21–25: Remove existing words with a fade-out effect by adding duration to the transition of the text color to white (background color)
.transition().duration(1000).style(“fill”, “white”)before removing the words completely. - Line 28–33: Enter the text that doesn’t exist on the DOM yet, same to how we created the first frame.
- Line 40–47: Finally, we use the
setInterval()function to call thetransitionText(data)function by filtering the data with each year from 1998 to 2017 every 2000 ms. Stop usingclearInterval()when the year hits 2017.