
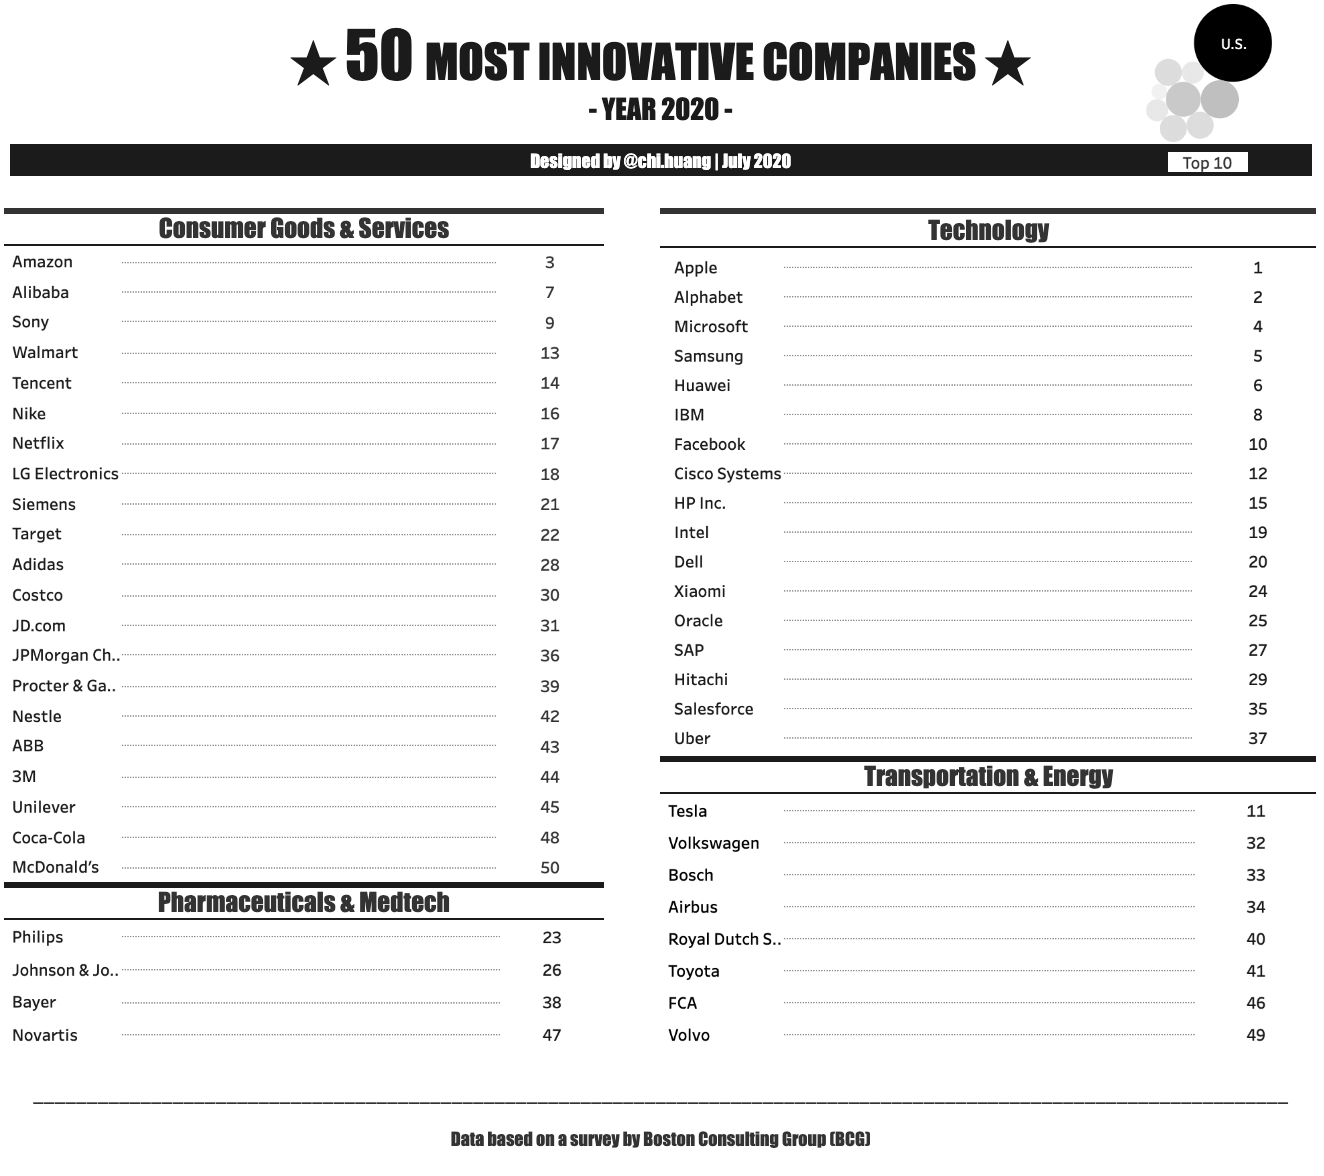

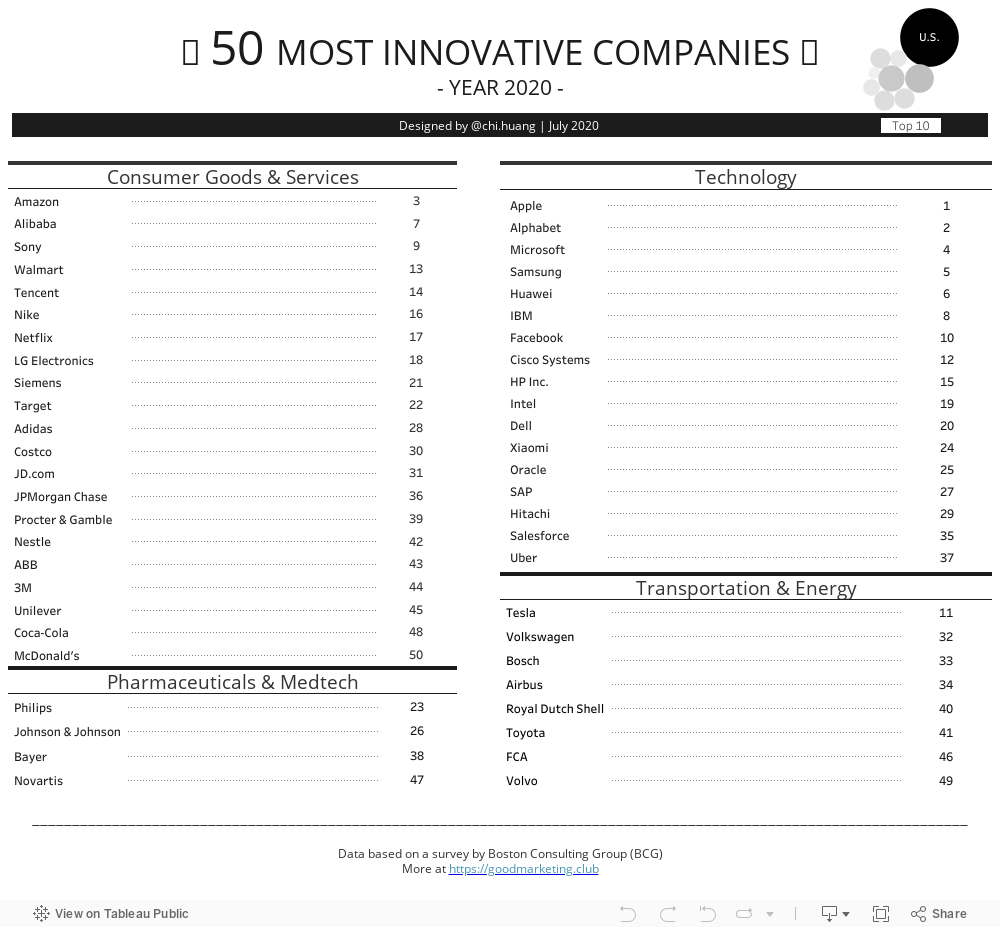
I came across a BCG report on the 50 most innovative companies and thought it would be cool to do a visualization on the dataset, broken down by industry and country. The ranking is mostly based on a survey of 2,500 global executives — are the results aligned with what you have in mind?
Subscribe to access the Tableau workbook and data of this viz.
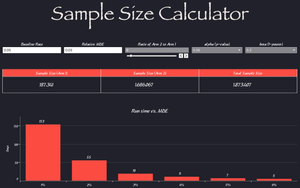
![Sample Size Calculator [Tableau Workbook]](/content/images/size/w300/2021/09/samplesizecalculator.png)