
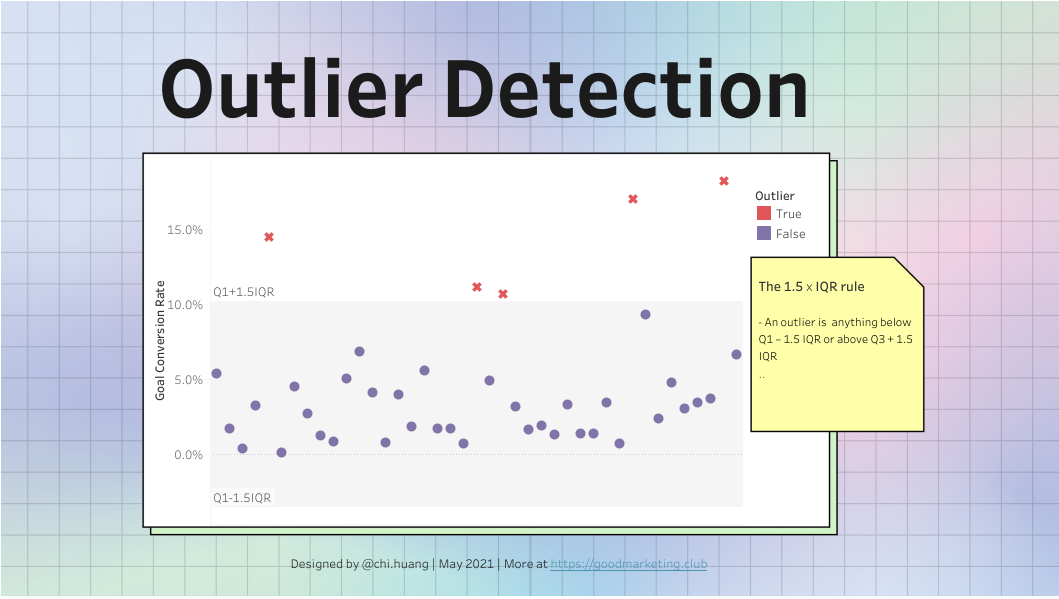

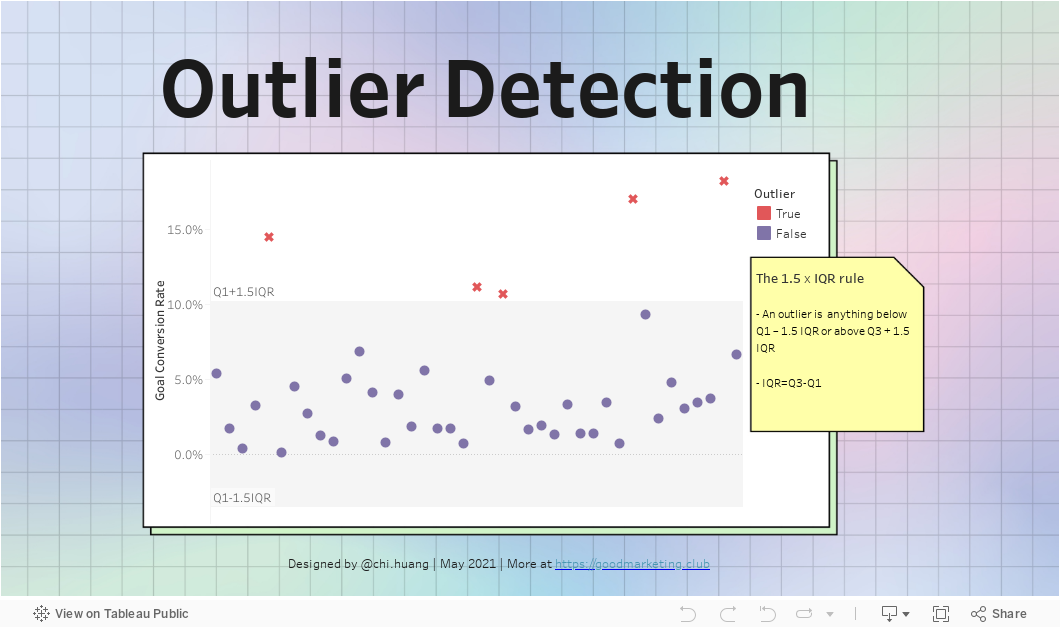
A common rule to identify outliers is the 1.5*IQR rule, meaning any data points that are more than 1.5*IQR above the Q3 (the third quartile) or below Q1 (the first quartile).
In this post, I am going to show you how to implement this rule in Tableau to identify outliers, an important step in data exploration.
Club members can download the dashboard template and sample data here for free.
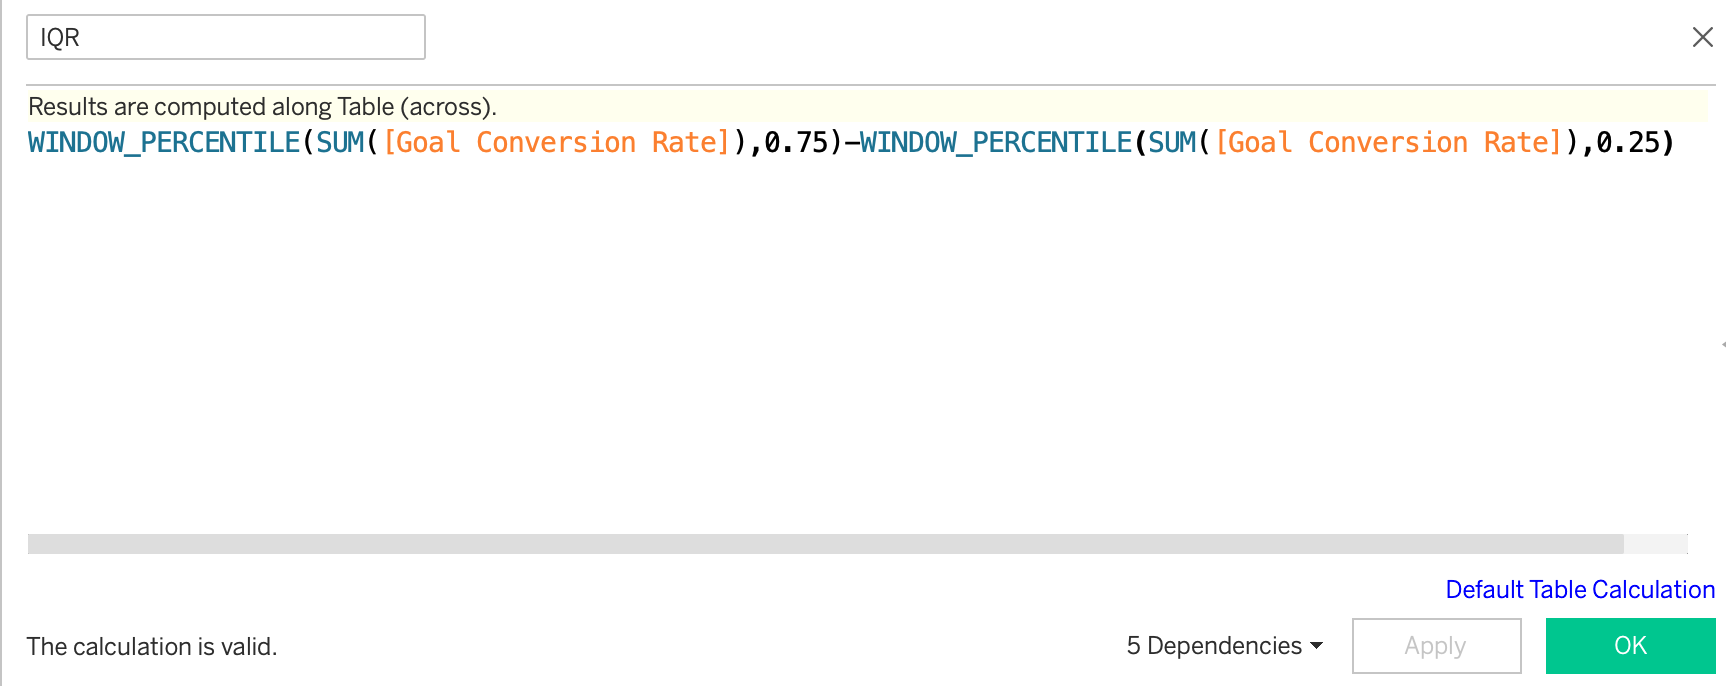
Compute Q1, Q3, and IQR
Use window_percentile function to compute the third quartile and first quartile for the entire table. Use Q3-Q1 to get IQR.
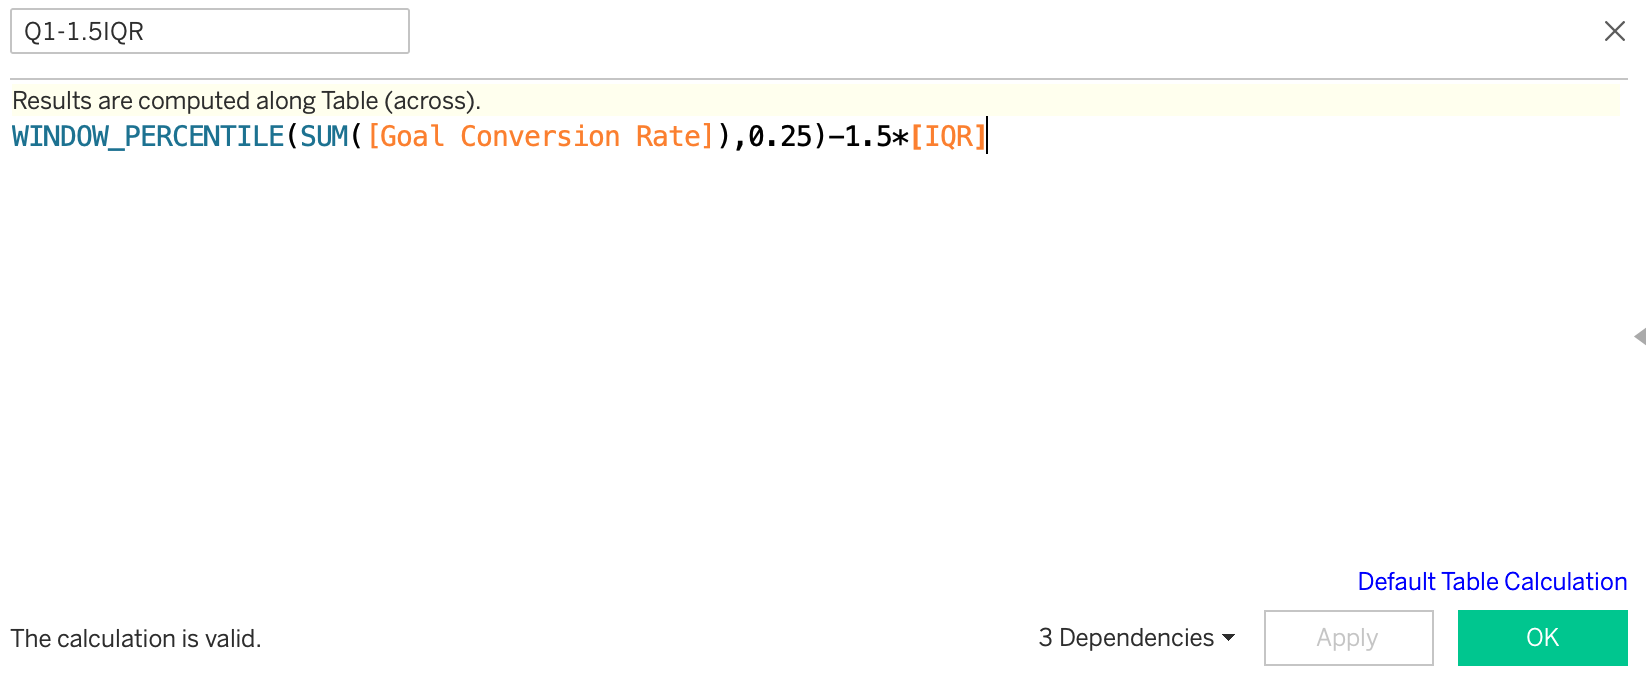
Compute Q1-1.5IQR as the lower bound
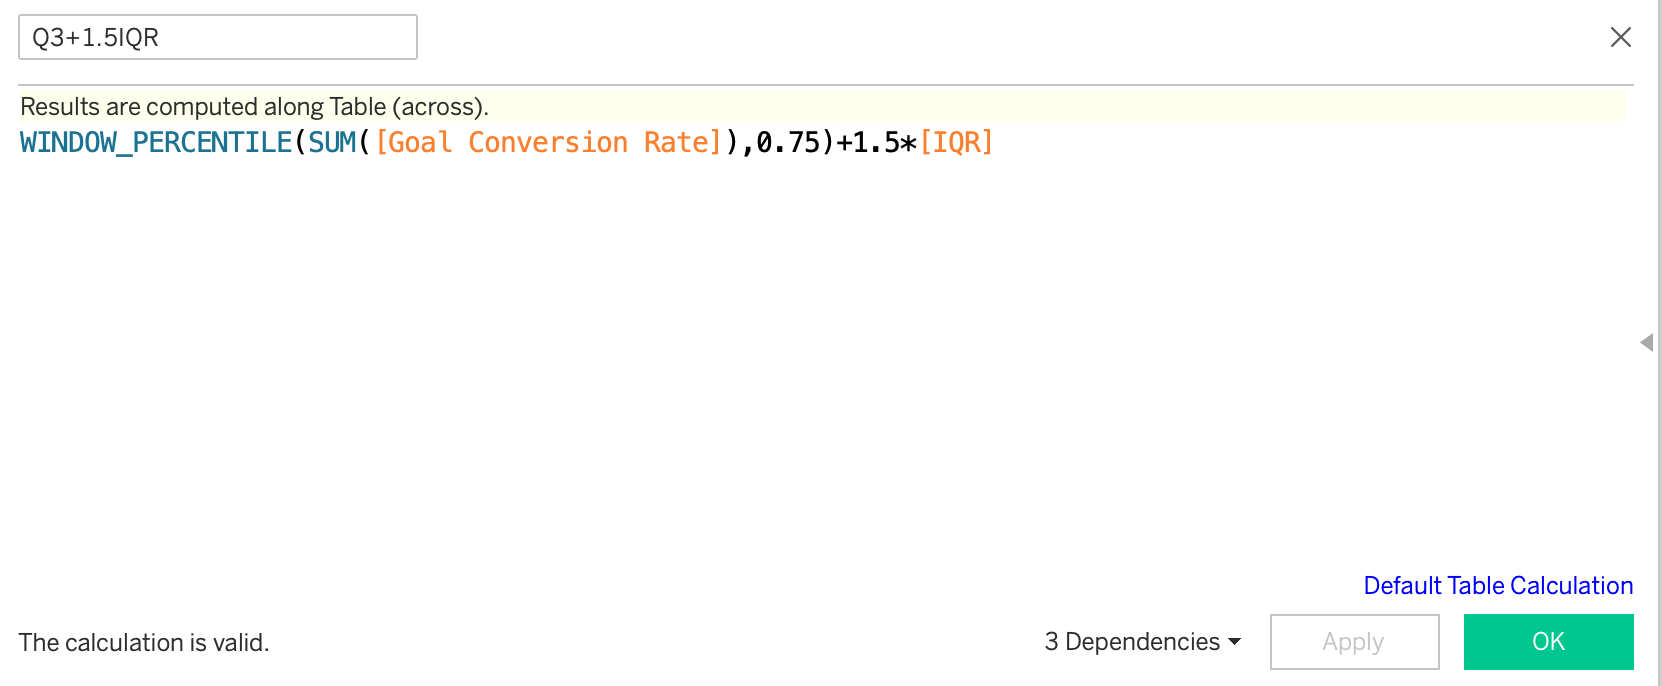
Compute Q3+1.5IQR as the upper bound
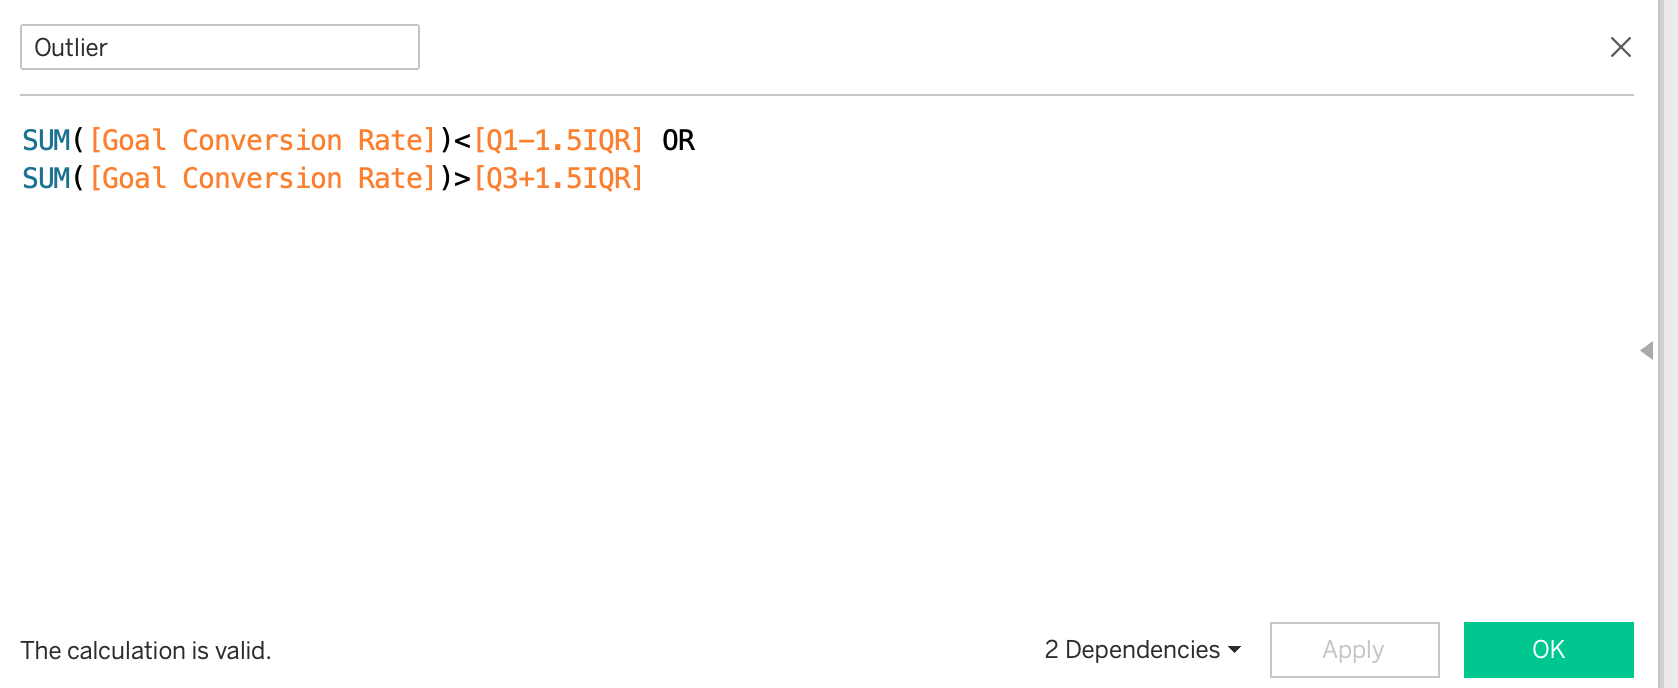
The Outlier Flag
Specify what constitutes an outlier for the target metric.
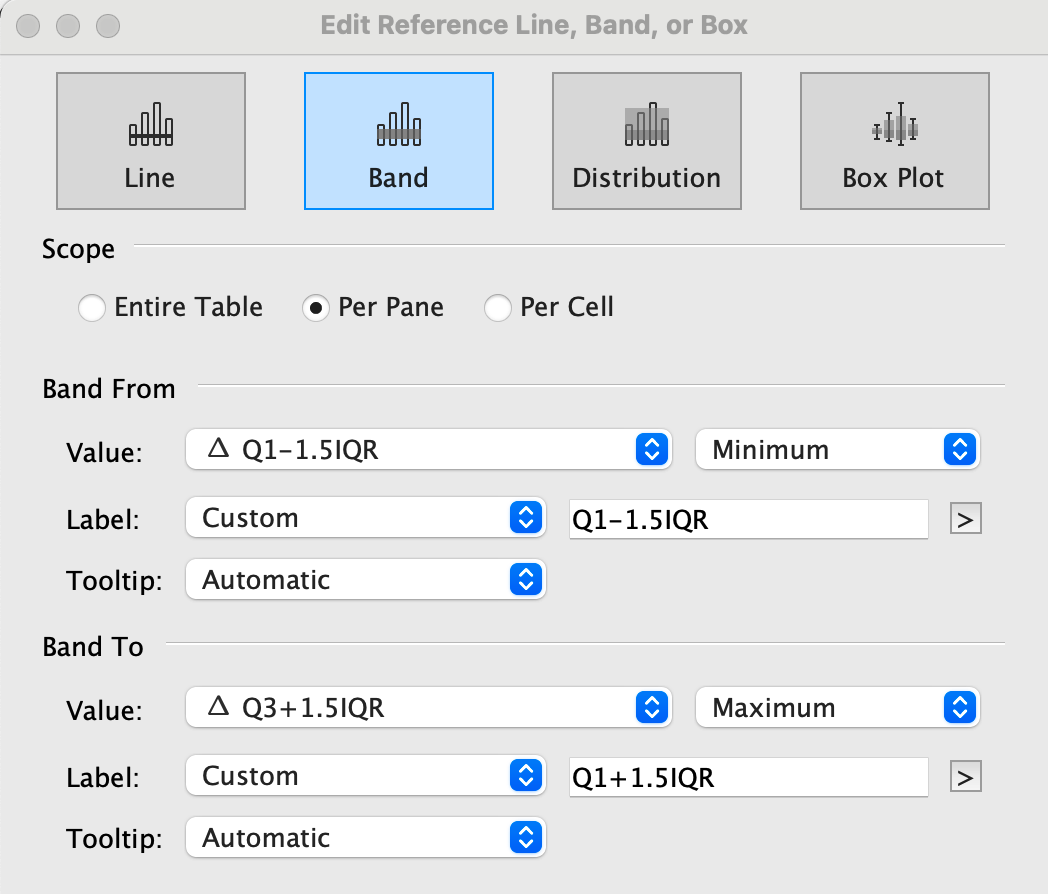
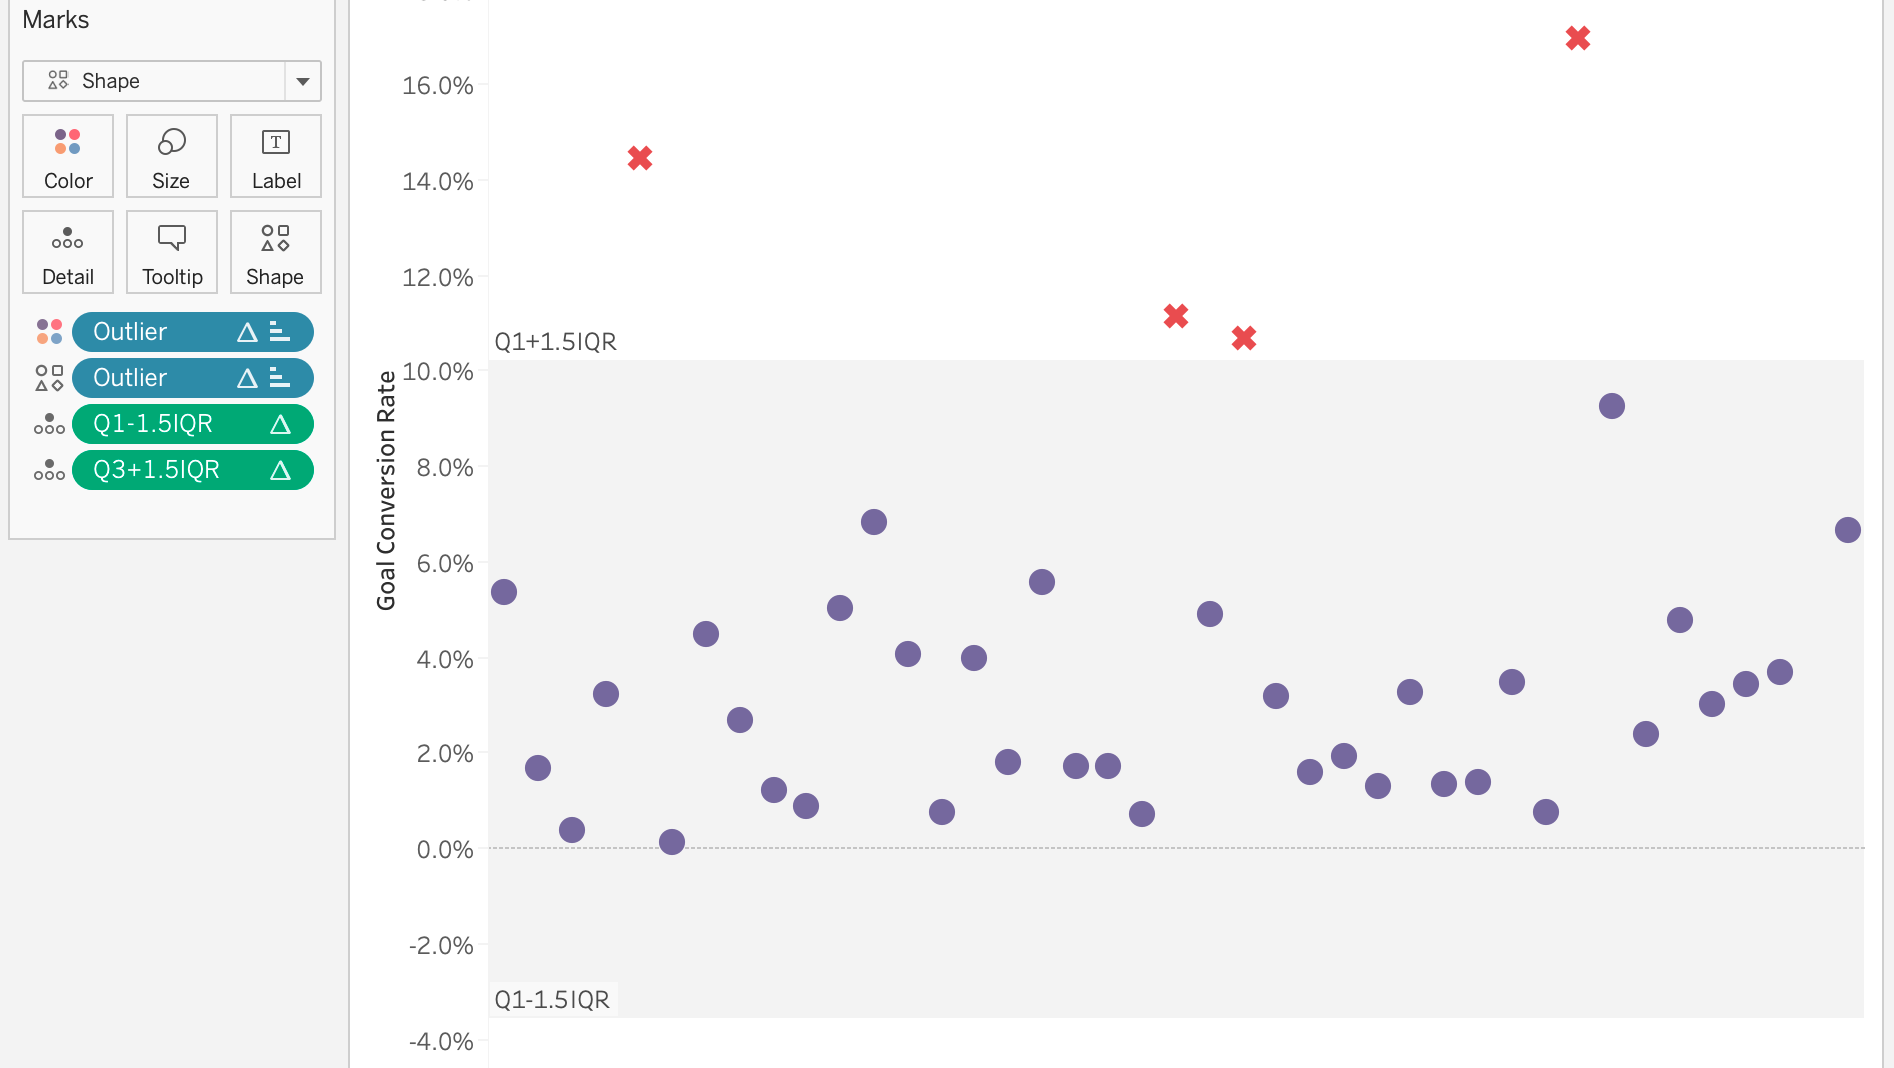
Indicate Outliers and Bounds in Chart
- Use reference band to the lower bound to Q1-1.5IQR and upper bound to be Q3+1.5IQR
- Use the outlier flag for color and shape
Background made with Canva - my one-and-only tool for any design needs.
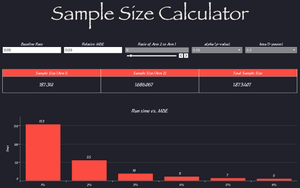
![Sample Size Calculator [Tableau Workbook]](https://storage.ghost.io/c/86/ef/86ef37c4-a2ea-4141-8365-88fa6bf16ba7/content/images/size/w300/2021/09/samplesizecalculator.png)