
When I was learning D3, although there are a lot of great resources to learn from, I can rarely find detailed code explanations for me to fully understand how everything works, making it difficult to recreate a chart on my own without additional searches. So I want to fill this whitespace with a series of D3 (v4) line-by-line code explanations for each chart I create, sharing with you what I’ve figured out.
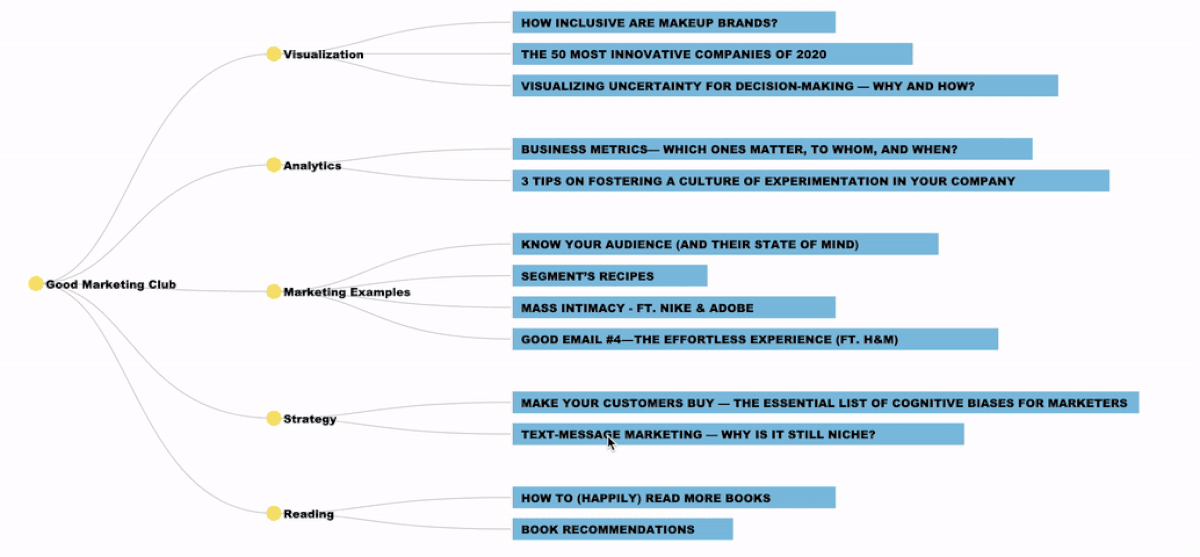
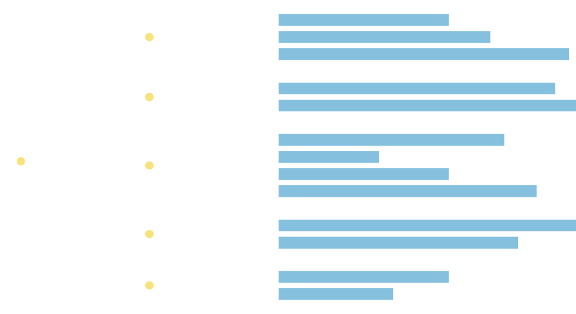
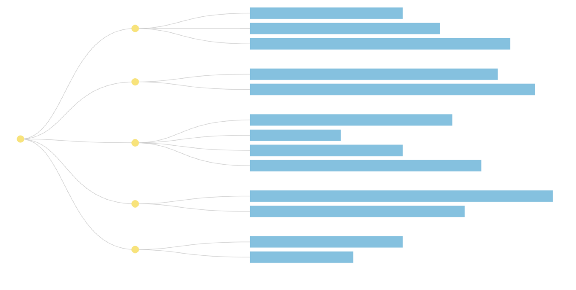
Let’s kick off this series by building a tree chart like the one below.
If you are completely new to D3, you should start with this post.
Set Up the Canvas
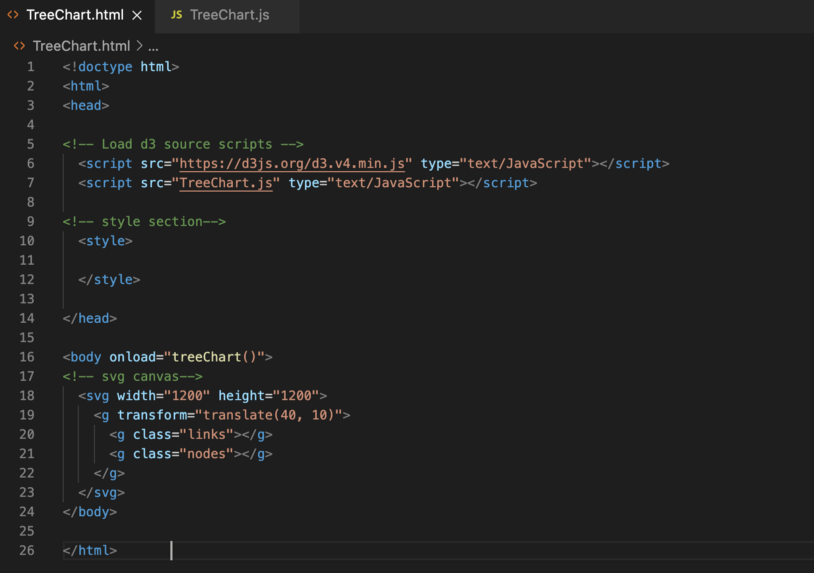
To set up the canvas for D3 graphs, in your HTML file :
- Line 6: Load D3 directly from d3js.org — so you don’t need to install locally
- Line 7: Load TreeChart.js that we are going to build our D3 graphs in
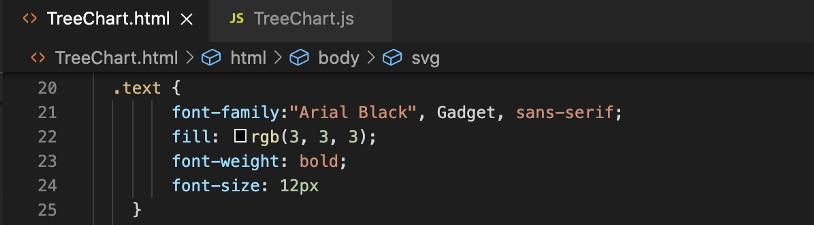
- Line 10–12: Style section that we are going to put style code in
- Line 16:
onload= “treeChart()”means we are telling the system to load thetreeChart()function in TreeChart.js immediately to show D3 graphs after the page has been loaded - Line 18: Create a
SVGin the size of 1200px by 1200px for us to put graphic elements in later - Line 19: Put in a g element to group all the nested SVG shapes so you can transform them together. In this case, we move all shapes 40 px along the x-axis and 10 px along the y-axis using the
translate()function so they are all visible. - Line 20: Add two more g elements to group tree links (
class=“links”) and tree nodes(class=“node”) respectively. The “links” class needs to be declared before the “node” class so the links appear behind the nodes. You can switch the two lines of code around to see for yourself.
Transform Tabular Data to Hierarchical Data
Now we move on to creating the graphs in TreeChart.js that we linked in the HTML. The most common input data is tabular data. We need to transform it into a hierarchical form to construct a tree chart.
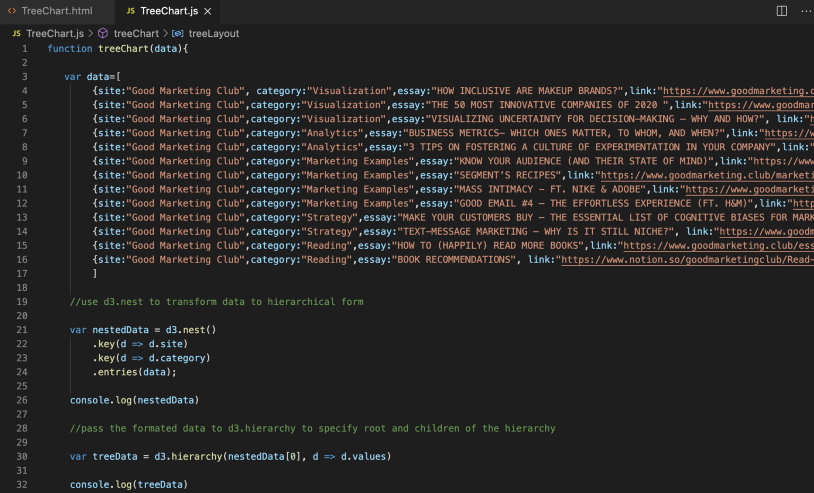
Line 1: create the treeChart(data) function, which will be loaded when the page has been loaded.
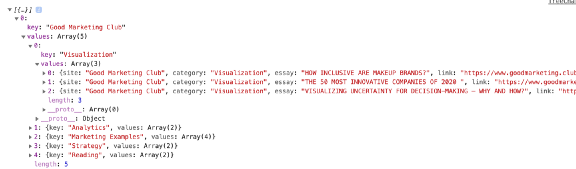
Line 3–17: I input the data directly here. But this is the data format you would get if you read a tabular data file with d3.csv() for example.
{site:”Good Marketing Club”,
category:”Visualization”,
essay:”HOW INCLUSIVE ARE MAKEUP BRANDS?”,
link:”https://www.goodmarketing.club/visualization/how-inclusive-are-makeup-brands"
}
Line 21–26: Use d3.nest()to group dataset first by the ‘site’ column (.key(d=>d.site))and then by the category column (.key(d=>d.category)) to create a nested hierarchical data structure. I recommend using console.log() to see the output in your browser console to better understand the transformation here.
console.log(nestedData)Line 30–32: Pass nestedData to d3.hierarchy(). The goal here is to specify the data (nestedData[0]) and the children (d=>d.values) to construct a relationship between the root node (the node with no parent) and its children for us to map out the tree layout. Again, use console.log() to see the output here.
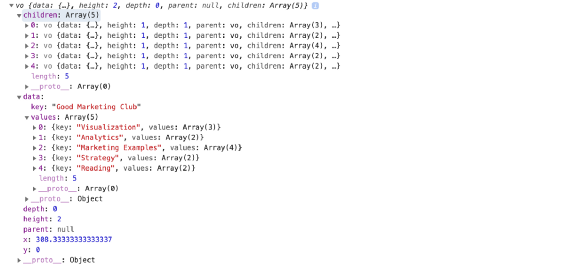
console.log(treeData)Build Nodes of the Tree Chart
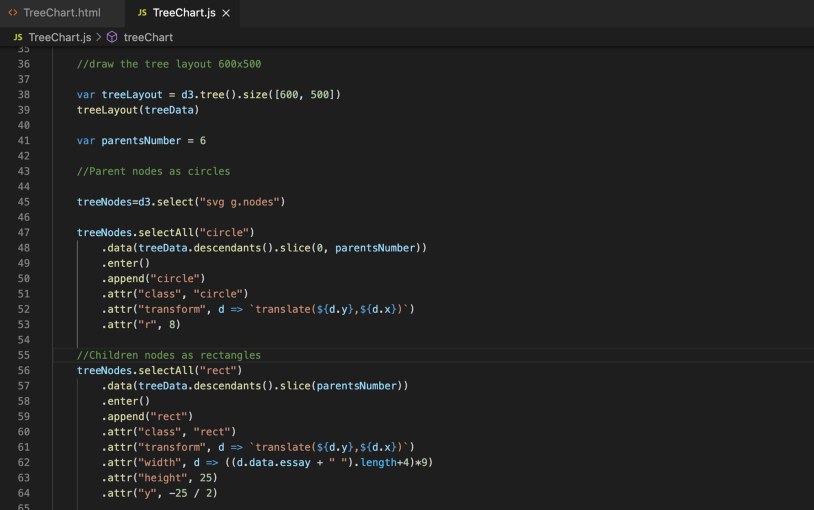
Line 38: Use d3.tree() to create a tree layout with a size of 600px*500px
Line 39: Pass our previously formatted treeData through treeLayout() to assigns the x and y positions for the nodes that can be accessed through d.x and d.y afterward.
Line 41: Declare a variable parentsNumber to store the number of nodes that have children, we will style them differently than non-parents.
Line 45: Select the SVG canvas and append g elements in the class of nodes — assign g and nodes class to move and style all nodes together.
Line 47–53: We want to create nodes with children as circles. This is achieved by (i) selecting all the circles (ii) passing the array of nodes with children through — accessed through treeData.descendants().slice(0,parentsNumber)(iii)append the circles and assign a class of circles so we can style them together later (iv) by default, the tree chart is created from top-down, because we want to create it from left to right, we need to assign the positions of circles using translate()function by d.y and d.x instead of d.x and d.y. (v)Finally, assign the radius of circles as 8.
Line 56–64: We want to create nodes without children as rectangles. This is done in a similar way to the step before. The only thing to note here is when drawing the rectangles, we assign a width based on the number of characters of the text, and the y position of the rect (top left corner) is adjusted to be centered in relation to the text and link we will build later.
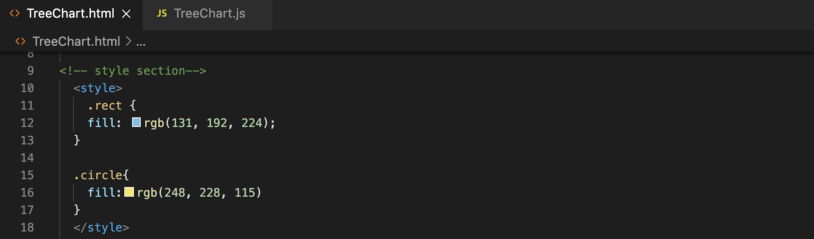
After adding the styling of the circle (.circle) and rect class (.rect), you should see the output below.
Build Links of the Tree Chart
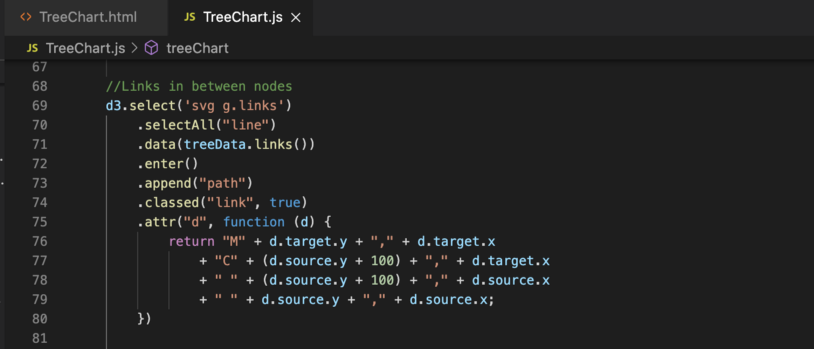
Line 68–72: Select the SVG canvas and append g elements in the class of links, to differentiate from the nodes class we assigned before. We can access the array of objects containing all the parent-child links using treeData.links() .
Line 73–80: Links between nodes are created by appending .append(“path”) . Attribute “d” is used to tell D3 how to draw the path.
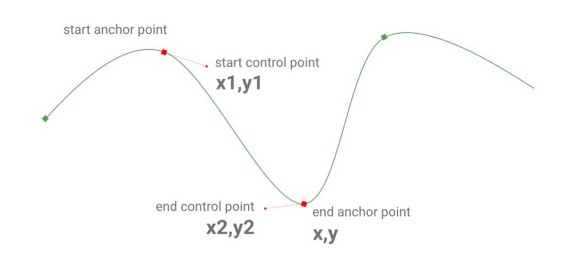
We start with “M” (the move to command with x,y parameters), we tell the D3 to move to where the child node is at (d.target.y, d.target.x) without drawing the line. Then start from that point we draw a cubic Bézier curve with the “C” command (with x1,y1| x2,y2| x, y parameters). With the code above, we are telling D3 to draw a cubic Bézier curve:
- Start from
d.target.y, d.target.x(child node) - End at
d.source.y, d.source.x(parent node) - With
d.source.y+100, d.target.xas the start control point - With
d.source.y+100, d.source.xas the end control point
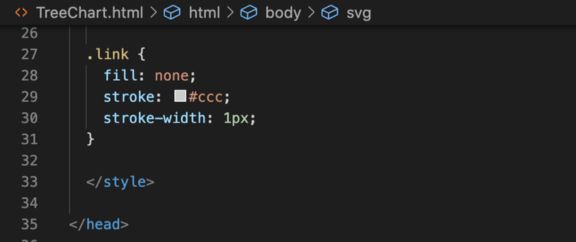
After styling the link class (.link), you should see the output below.
Add Text, HyperLinks, and Animations
We are almost there! The final step is to complete the chart with text notations, hyperlinks, and hover-over animations over the hyperlinks to indicate that they are clickable.
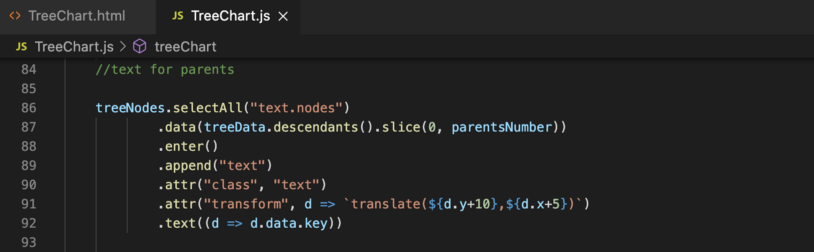
Line 86–90,92: Similar to what we did before, we slice the data to only pass parents nodes data through, but this time we append “text” element to it, texts of the parent nodes are accessed through d.data.key.
Line 91: The text is transformed a little bit more along the x and y axis so they don’t overlap with the shapes with the same starting point. You should try changing up the values and see for yourself.
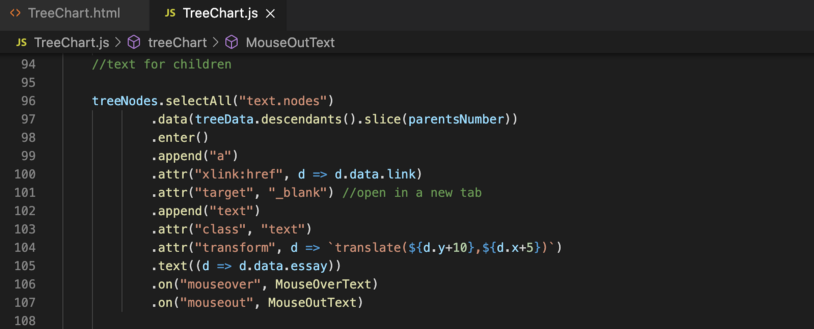
We basically do the same to children (non-parent) nodes to add the text in.
Line 99–101: We add hyperlinks to the text by appending “a” and add the links by passing values of the ‘link’ column accessed throughd.data.link . We use .attr(“target”,”_blank”)to open each link in a new tab.
Line 106–107: Finally, we call the two animation functions we are going to build next, telling D3 to run each function when the user “mouseover” and “mouseout” the text elements of the children (non-parent) nodes.
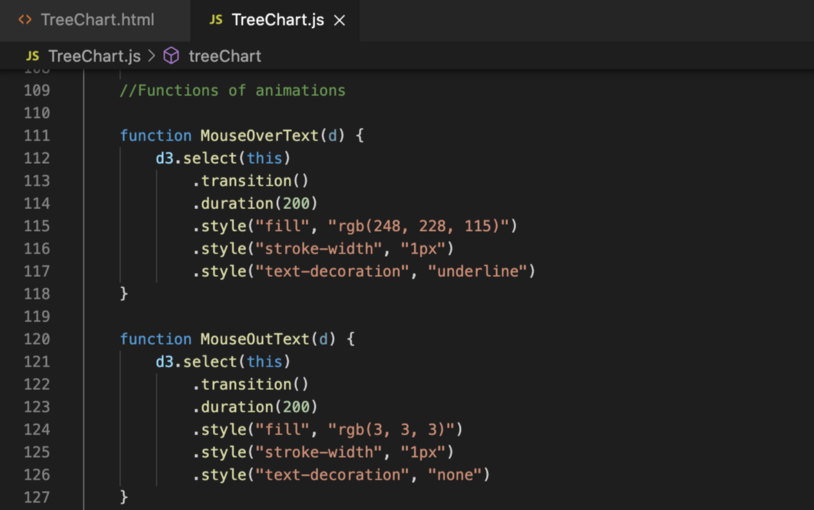
Line 111–118: Select the element that the function is called with, change the element (.transition()) to the styles specified in line 115–117, the transition process should last 200ms (duration(200)). If you specify the duration to be longer, you will see a fade-in effect.
Line 120–126: The same logic as before, but we are just changing the style back to what it was before.
After the final styling of the text class, you should see the completed interactive tree chart below!