

Set Up the Canvas
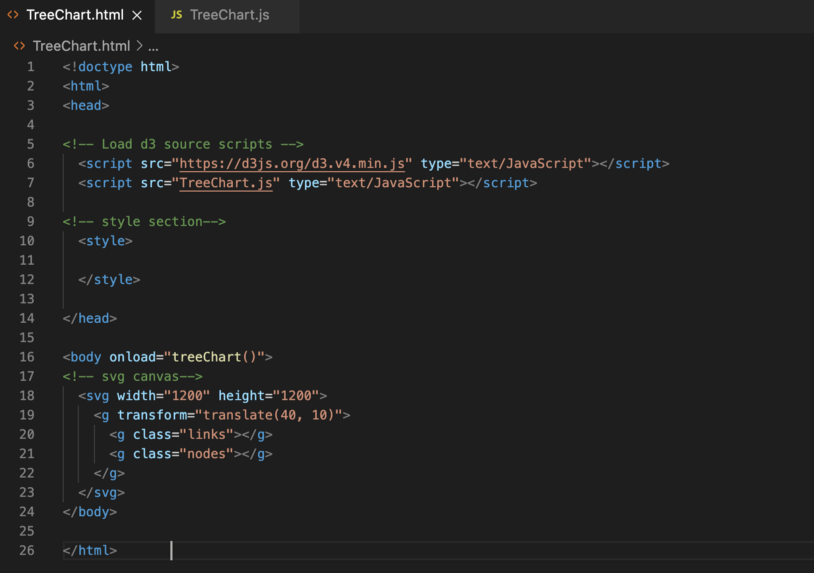
To set up the canvas for D3 graphs, in your HTML file :
- Line 6: Load D3 directly from d3js.org — so you don’t need to install it locally
- Line 7: Load TreeChart.js that we are going to build our D3 graphs in
- Line 10–12: Style section that we are going to put style code in
- Line 16:
onload= “treeChart()”means we are telling the system to load thetreeChart()function in TreeChart.js immediately to show D3 graphs after the page has been loaded - Line 18: Create a
SVGin the size of 1200px by 1200px for us to put graphic elements in later - Line 19: Put in a g element to group all the nested SVG shapes so you can transform them together. In this case, we move all shapes 40 px along the x-axis and 10 px along the y-axis using the
translate()function so they are all visible. - Line 20: Add two more g elements to group tree links (
class=“links”) and tree nodes(class=“node”) respectively. The “links” class needs to be declared before the “node” class so the links appear behind the nodes. You can switch the two lines of code around to see for yourself.
Transform Tabular Data to Hierarchical Data
Now we move on to creating the graphs in TreeChart.js that we linked in the HTML. The most common input data is tabular data. We need to transform it into a hierarchical form to construct a tree chart.

![Sample Size Calculator [Tableau Workbook]](https://storage.ghost.io/c/86/ef/86ef37c4-a2ea-4141-8365-88fa6bf16ba7/content/images/size/w300/2021/09/samplesizecalculator.png)