

Set Up the Canvas
To set up the canvas for D3 graphs, in your HTML file :
- Line 4: Load D3 directly from d3js.org — so you don’t need to install locally.
- Line 7–51: Style section to style different elements.
- Line 56:
onload= “hoverOver()”means we are telling the system to load thehoverOver()function immediately to show D3 graphs after the page has been loaded. - Line 58–59: Create a
SVGin the size of 1000px by 300px for us to put graphic elements in later.
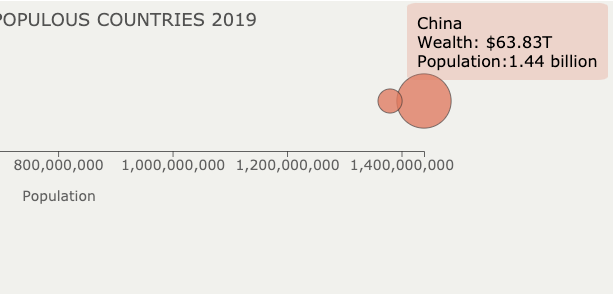
Draw Axis, Title, and Source with D3
Now we move on to creating the hoverOver() function, which we will put into the <script></script> section after the body section. It’s recommended to create the D3 script in a separate file. But for the ease of sharing, I will put it together with the rest of the HTML.
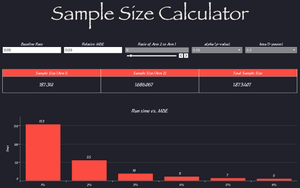
![Sample Size Calculator [Tableau Workbook]](https://storage.ghost.io/c/86/ef/86ef37c4-a2ea-4141-8365-88fa6bf16ba7/content/images/size/w300/2021/09/samplesizecalculator.png)