

This post is based on notes from reading Controlled experiments on the web: survey and practical guide by Ron Kohavi, Roger Longbotham, Dan Sommerfield, and Randal M. Henne. Read part 2 here.
Terminology
- Overall Evaluation Criterion (OEC):
- A quantitative measure of the experiment's objective
- not be short term focus and should predict long-term goals
- a single metric forces tradeoffs to be made once for multiple experiments and align the organization behind a clear objective.
2. Factor:
- a controllable experimental variable that is thought to influence the OEC
3. Variant:
- a user experience being tested by assigning levels to the factors
4. Experimental unit:
- the entity over which metrics are calculated. By user is preferred. It is important that the user receive a consistent experience throughout the experiment, and this is commonly achieved through randomization based on the user id stored in cookies
**when randomization by user is not appropriate
- control may affect the effectiveness of the treatment (eBay bidding randomly assigns products)
- not desirable to randomize based on user (price elasticity study - randomize on products)
- not possible to randomize on user
5. Null hypothesis:
- The hypothesis that variants are not different and any observed differences during the experiment is due to random fluctuations
6. Confidence level:
- Set to 95% implies that 5% of the time we will incorrectly conclude there is a difference when there is none. All else being the same, increasing this will reduce the power.
- [false positive] Type I error(α)= 1- confidence level
7. Power
- the probability of corectly rejecting the null hypothesis when it is false, abiltiy to detect a difference when it exists.
- [false negative]Type II error ( β) = 1-power
8. A/A test
- collect data and assess its variability for power calculations
- Test experimentation system
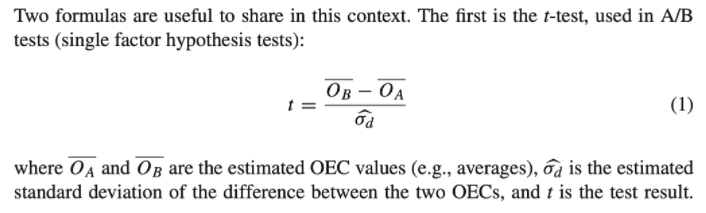
9. T-test:
A t-test is a type of inferential statistic used to determine if there is a significant difference between the means of two groups.
10. Chi-Square-Test:
A chi-square test is a statistical test used to compare observed results with expected results. The purpose of this test is to determine if a difference between observed data and expected data is due to chance, or if it is due to a relationship between the variables you are studying.
11. Standard Deviation
A measure of variability
σ = sqrt [ Σ ( Xi - X )2 / N ]
12. Standard Error
The stander deviation of the sampling distribution of the sample statistic.
Hypothesis testing and sample size
- Confidence level: commonly set to 95%, which implies that 5% of the times we are incorrectly concluding there is a difference when there's none. Everything being equal, increasing this level reduces our power
- Power: commonly desired to be around 80% - 95%, although not directly controlled. If the null hypothesis is false, the power is the probability of determining that the difference is statistically significant.
- Standard error: the smaller the std-err the more powerful the test, you can reduce the standard error by:
- increasing the sample size
- use OEC with lower variability: example rank of std-dev: cvr< number of purchase units <revenue
- Lower variability of the OEC by filtering out users who were not exposed to the variants, yet were still included in the OEC. E.g.If you make a change to the checkout page, analyze only users who got to the page, as everyone else adds noise, increasing the variability.
4. Effect - the difference in OEC for the variants. Larger differences are easier to detect, so great ideas will unlikely be missed. Conversely, Type II errors are more likely when the effects are small.
5. T-test: assuming equal sample sizes across variants
6. Minimum Sample Size*
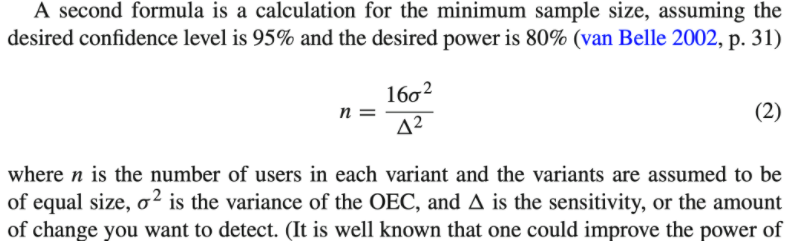
change 16 (80% power) to 21 to get 90% power
*given cvr=0.05, σ= sqrt(0.05*(1-0.05)) from Bernoulli distribution.
Note: The choice of OEC must be made in advance: otherwise there's an increased risk of finding what appear to be significant results by chance (familywise type I error).
- adjustments: Fisher’s least-significant-difference, Bonferroni adjustment, Duncan’s test, Scheffé’s test, Tukey’s test, and Dunnett’s test
- These will increase the confidence level and reduce the statistical power
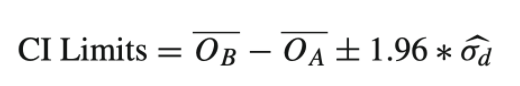
Confidence Intervals
- It's useful to give a confidence interval for the difference in the means of the treatment and control.
- a confidence interval gives a range of plausible values for the size of the effect of the treatment, hypothesis test only determines if there's a statistically significant difference in the mean
- the 95% confidence interval is:
Effects of robots on experimental results
- Robots can introduce significant skew into estimates, enough to render assumptions invalid. We have seen cases where robots caused many metrics to be significant when they should not have been (>5% false positives for A/A tests)
- It's important to remove the type of robots that interact with the user_id.
- javascript (client-side) vs. server-side call: it's generally thought that few robots will be included in the experiment if the treatment assignment is called by javascript.
- exclude unidentified requests from the analysis, so treatment assignment and data collection is based only on users with user id stored in the user's cookie, robots will not be counted in the numbers of users or in the data that is collected on user behavior.
- robots that accept cookies can have profound effects, especially if the robot has a large number of actions on site. Robots filtering can be accomplished through a combination of omitting users whose user agent is on a list of known robots and through the use of [heruistics] (http://robotics.stanford.edu/people/ronnyk/supplementaryAnalyses.pdf)
Extensions for online settings
- Treatment ramp-up: an experiment can be initiated with a small percentage of users assigned to the treatment(s), and you can gradually increase that percentage. If you plan to run an A/B test at 50%/50% you might start with a 99.9%/0.1% split and increase from 0.1% to 0.5% to 2.5% to 10% to 50%. At each step, you can analyze the data to make sure there are no egregious problems with the treatment before exposing it to more users.
2. Automation:
Once an organization has a clear OEC, it can run experiments to optimize certain areas automatically. If decisions have to be made quickly, those could be made with lower confidence levels with lower costs of mistakes. Multi-armed bandit: https://multithreaded.stitchfix.com/blog/2020/08/05/bandits/ and hoeffding races can be used for optimization.
3. Software migrations: experiments can be used to help with software migration with the goal of retaining the null hypothesis - the variants are not different. Because the goal here is to retain the null hypothesis, it is crucial to make sure the experiment has enough statistical power to reject the null hypothesis if it's false.
Limitations
- Quantitative metrics, but not explanations to explain why. Usability labs can be used to augment controlled experiments with users' comments.
- Short-term vs. long-term effects. Controlled experiments measure the effect on the OEC during the experimentation period, which could be a limitation but not really. Because long-term goals should be part of the OEC. Take search ads as an example, if your OEC is revenue, you might put ads over a page, but many ads hurt user experience, so a good OEC should include a penalty term of usage of real estate for ads that are not clicked. or use repeat visits and abandonment as OEC. Similarly, it's wise to look at delayed conversion metrics - latent conversions.
- Primacy and newness effects. The primacy effect is when you change something on the site and experienced users may be less efficient until they get used to it. The newness effect is when a new feature is introduced some users will investigate it with a lot of engagement. These effects imply that experiments need to be run for multiple weeks. But you can also choose to compute the OEC only for new users on the different variants since they are not affected by either factor.
- Features must be implemented. The feature must be implemented and be of sufficient quality to expose users to it
- Consistency: Users maybe notice they are getting a different variant than their friends and family or multiple variants using different computers.
- Parallel experiments - our experience is that strong interactions are rare in practice. Pairwise statistical tests can also be done to flag such interactions automatically.
- Launch Events and Media Announcement: If there's a big announcement made about a new feature, all users need to see it.
If you are interested in learning more about a/b/n testing, I highly recommend the book Trustworthy Online Controlled Experiments (A Practical Guide to A/B Testing) .