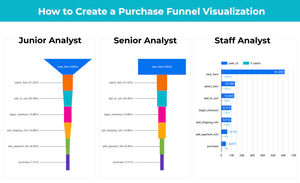


For time-series data, it’s often helpful to give users the options to choose the date granularity to best gauge the trend over time.
And you can achieve this in Tableau! Here’s how:
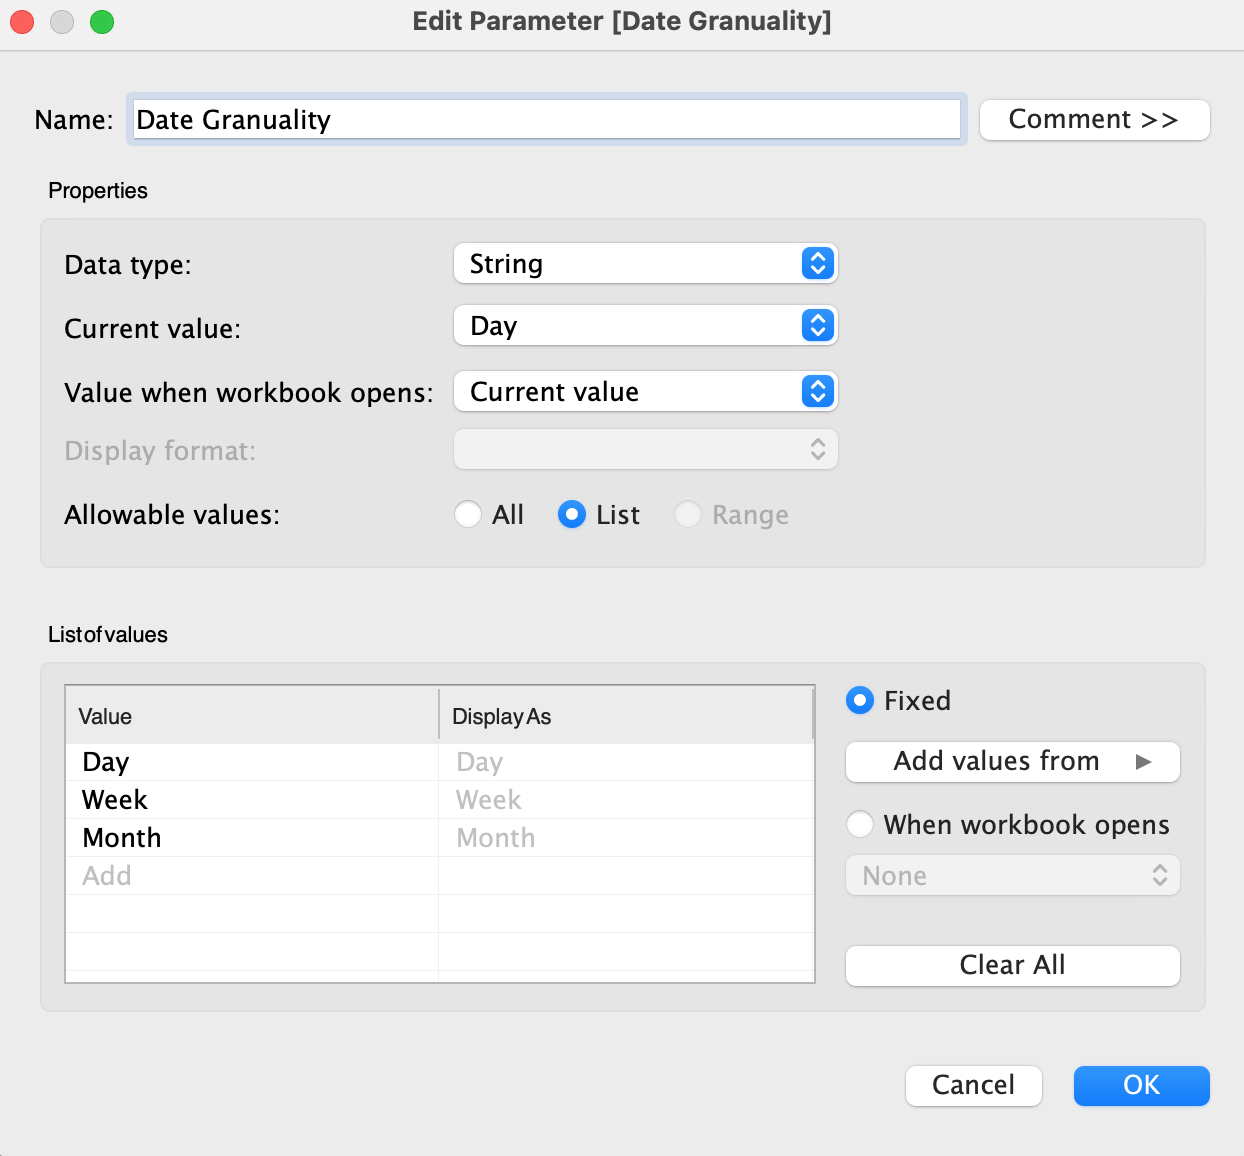
1.Create a parameter as the filter for users to select
- Data type: string
- Available values: list
- List of values is granularity levels you want: Day, Week, Month, Quarter, etc.
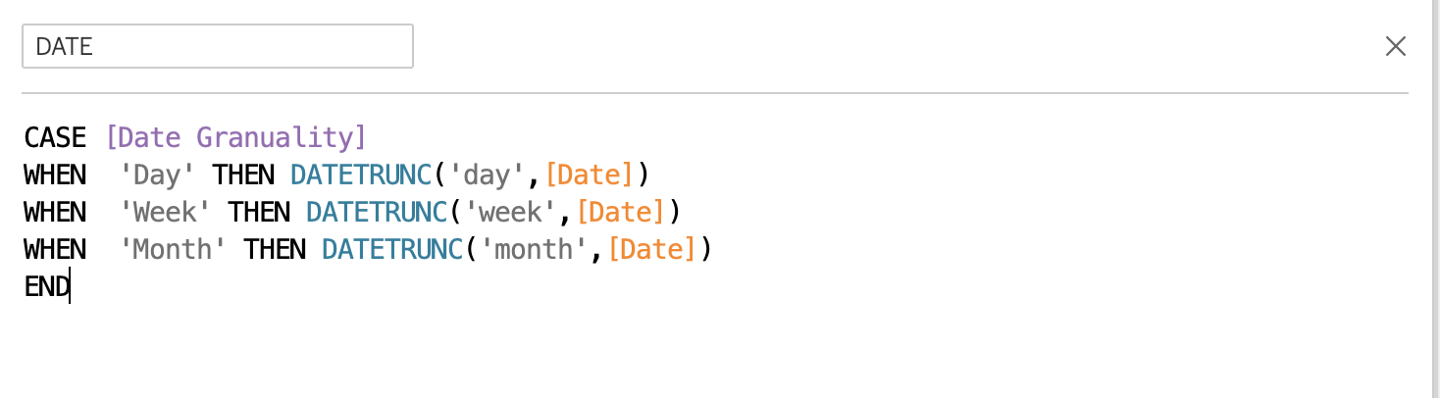
2.Create a new Date field based on the parameter you just created and the original date field.
The logic in the code below is when the parameter selected is ‘Day’, change the granularity of the original date field to ‘day’ level using DATETRUNC(). Use the same logic for other levels of granularity.
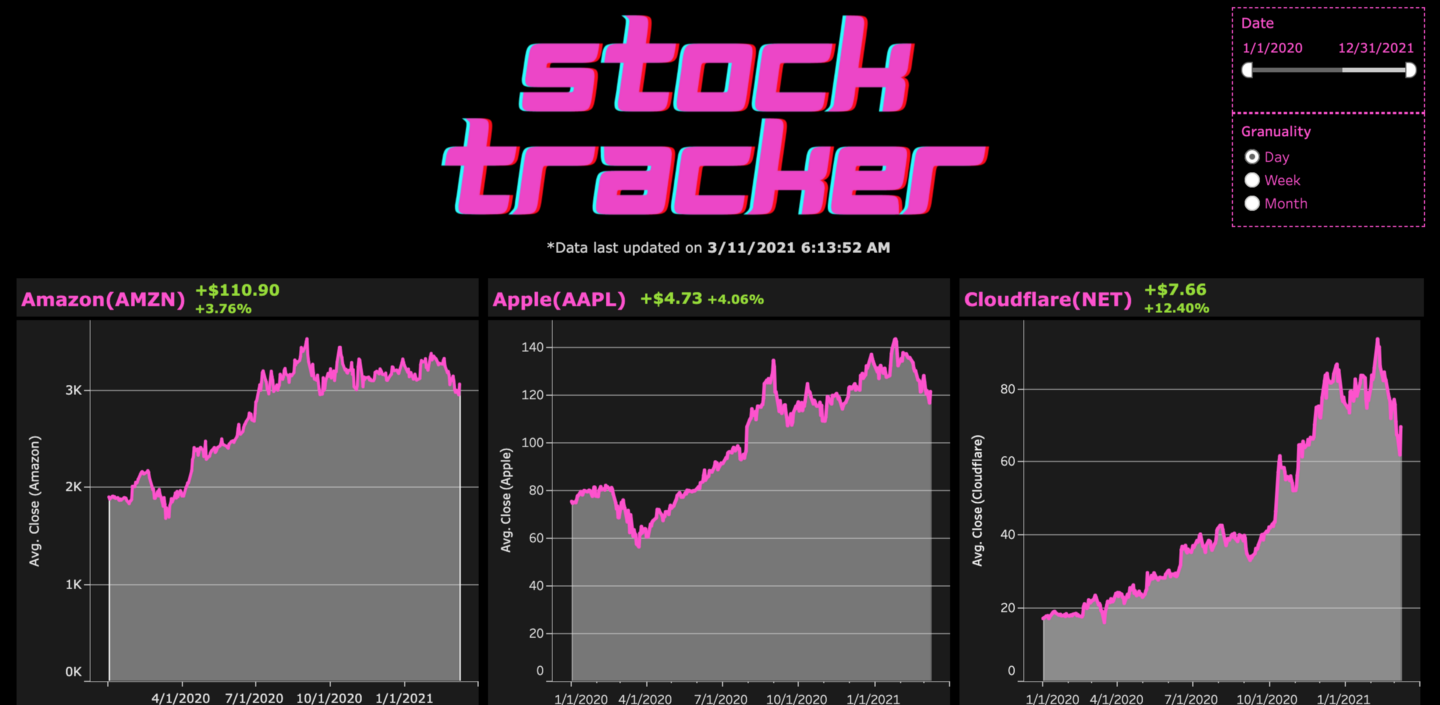
3.Put the newly created date field into the sheet and set it to ‘Exact Date’. Also, add the Date Granularity parameter into the sheet.
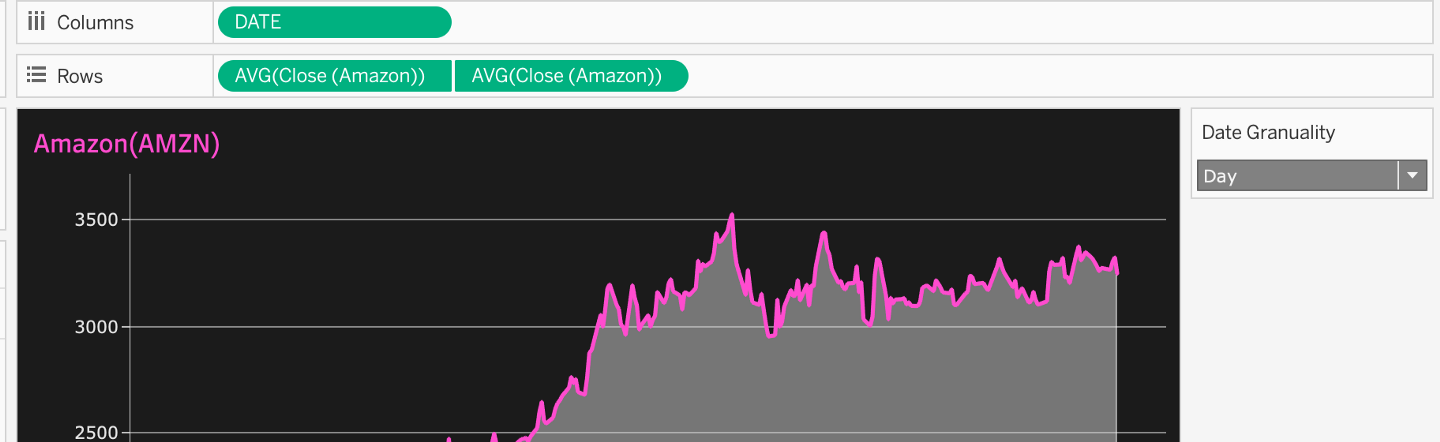
The final result:
More of Tableau dashboard gallery and free workbook downloads