
If you are like me, that your team relies on Tableau for real-time data and insights, you rely on Python for modeling, and you have to constantly switch between the two, then TabPy is the solution for you! It combines the best feature from both tools. You can share real-time modeling outputs, using just Python and Tableau, and bring data science to decision-makers.
Below is a step-by-step example of how you can use TabPy to do real-time clustering in Tableau.
Install and Set up TabPy
- Open your terminal and install TabPy (Anaconda)
conda install -c anaconda tabpy-server

conda install -c anaconda tabpy-client
2. Create and activate a virtual environment
#create a Anaconda environment in Python 3.6

conda create -n my-tabpy-env python=3.6

#activate tabpy

conda activate my-tabpy-env
3. Go to the directory where you install the TabPy server
cd you_directory_path4. Activate TabPy by running the startup.sh script in the folder
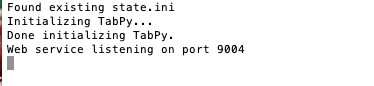
cd you_directory_pathYou should see the message below if everything goes well.
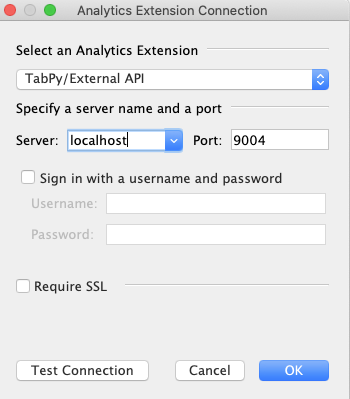
5. In your Tableau workbook, go to help>settings and performance>Manage Analytics Extensions and Connection.
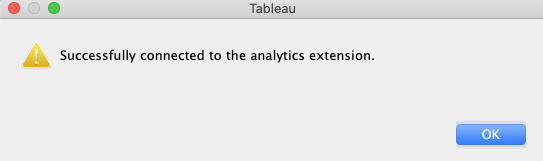
Enter the port number shown in your terminal (default:9004). Click ‘test connection’ and you should see a success message pop up.
KMeans++ Clustering with TabPy
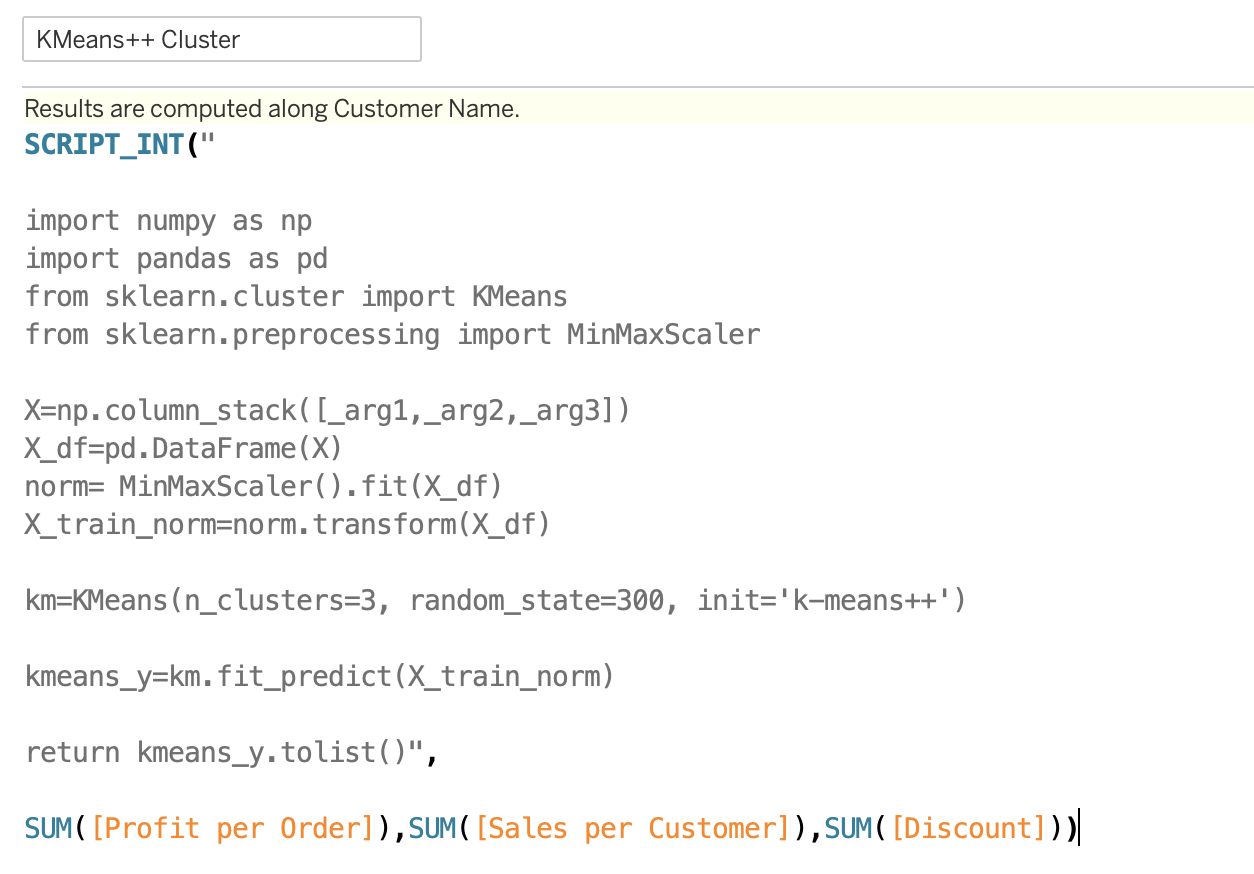
Method 1: Write scripts inline in Tableau
You can write scripts directly in Tableau, similar to what you would do in Python. Depends on your desired output, you can use SCRIPT_REAL, SCRIPT_STRING, SCRIPT_INT, or SCRIPT_BOOL to wrap the code in.
Be sure to edit table calculation to compute along the right field, default is computed along the table (across).
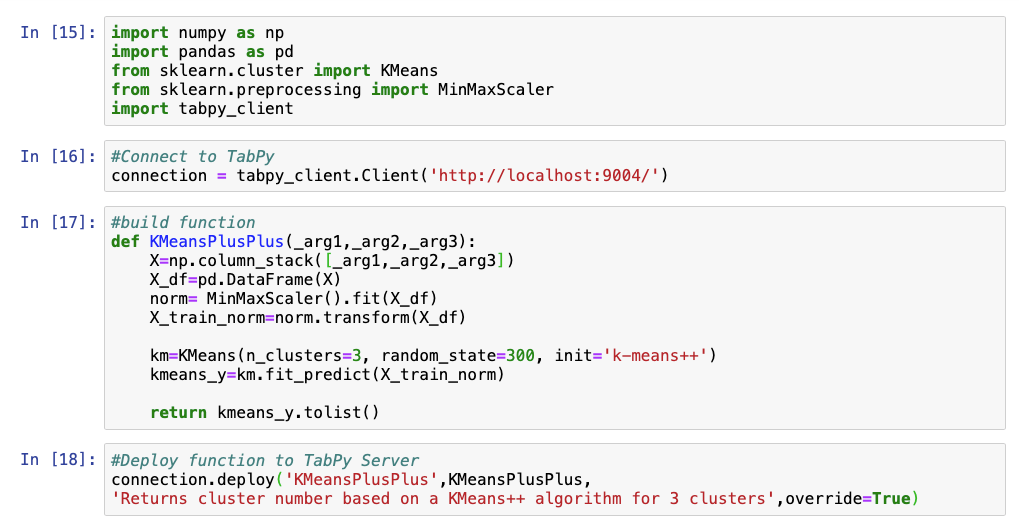
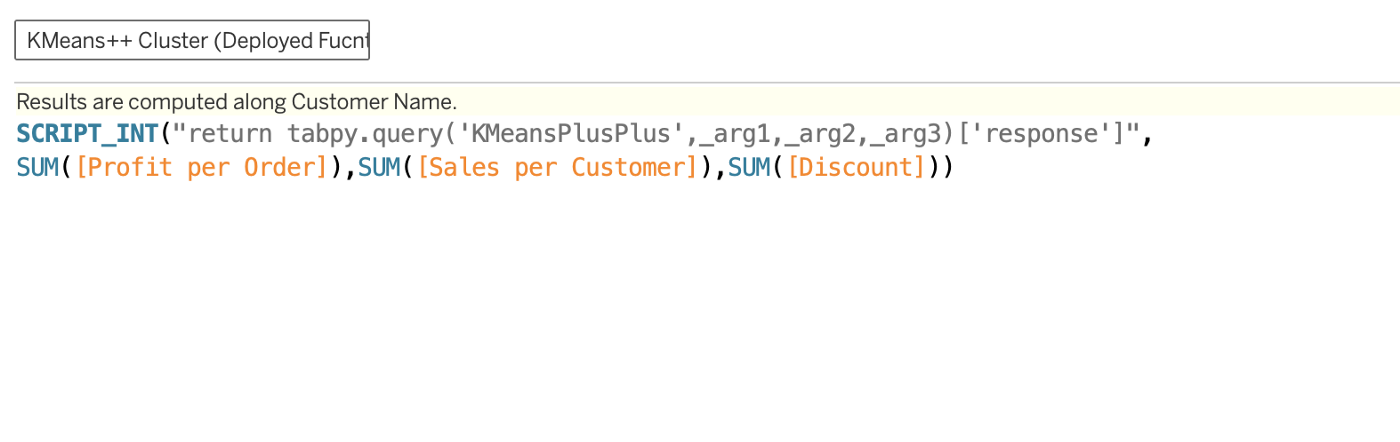
Method 2: Deploy functions and call from Tableau
For easier organization, you can also use the tabpy_client function to deploy functions from Python, and call the function from Tableau.
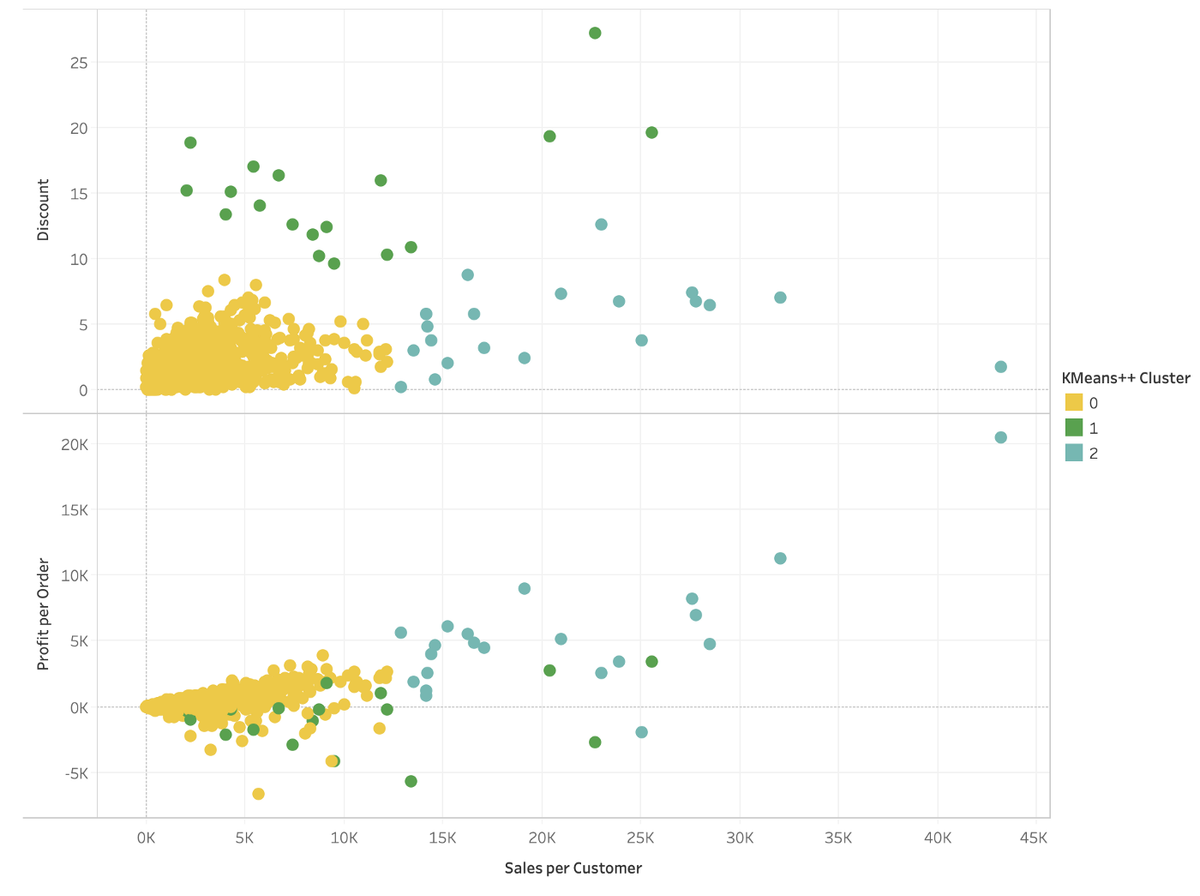
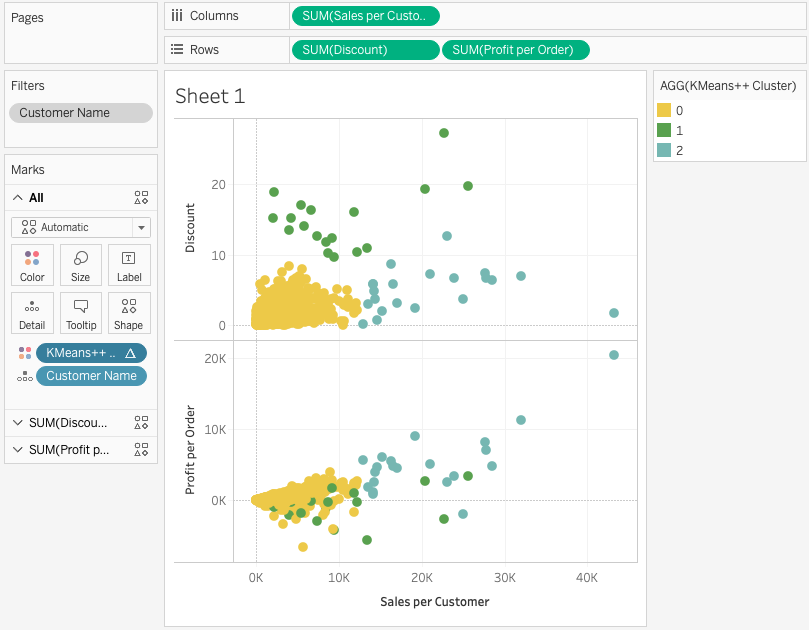
If successful, you should be able to build something like below. Using this chart, your team can instantly identify different clusters of customers, and use these insights in email/campaign segmentation.
Some Limitations
- TabPy is currently only supported in Tableau Server, so unless you have that, you cannot share your TabPy workbooks online. But word on the street is that it’s going to be available in Tableau online soon - available now!
- The output needs to be tweaked sometimes to be displayed in Tableau. For example, arrays need to be transformed into lists. You have to go through some trial and error for this.