When I was learning D3, although there are a lot of great resources to learn from, I can rarely find detailed code explanations for me to fully understand how everything works, making it difficult to recreate a chart on my own without additional searches. So I want to fill this whitespace with a series of D3 line-by-line code explanations for each chart I create, sharing with you what I’ve figured out.
Learn how to build four of the most popular interactive D3.js visualizations (tree chart, flourish bar chart, animated text, bubble chart with tooltip) for $☕x5.
Not sure yet? Check out a free tutorial first!
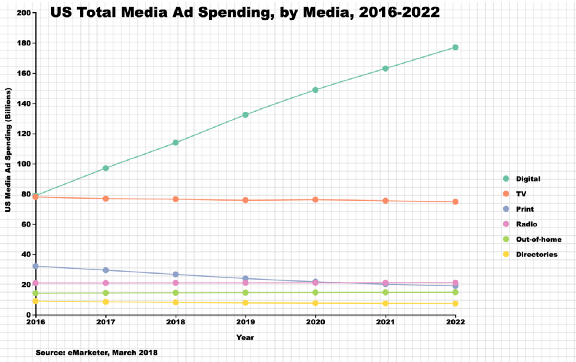
D3.js - Multiple Lines Chart w/ Line-by-Line Code Explanations
When I was learning D3, although there are a lot of great resources to learn from, I can rarely find detailed code explanations for me to fully understand how everything works, making it difficult to recreate a chart on my own without additional searches. So I want to fill this
 Chi
Chi